
2026 Commerce Napkin – Electronics
1. The Napkin
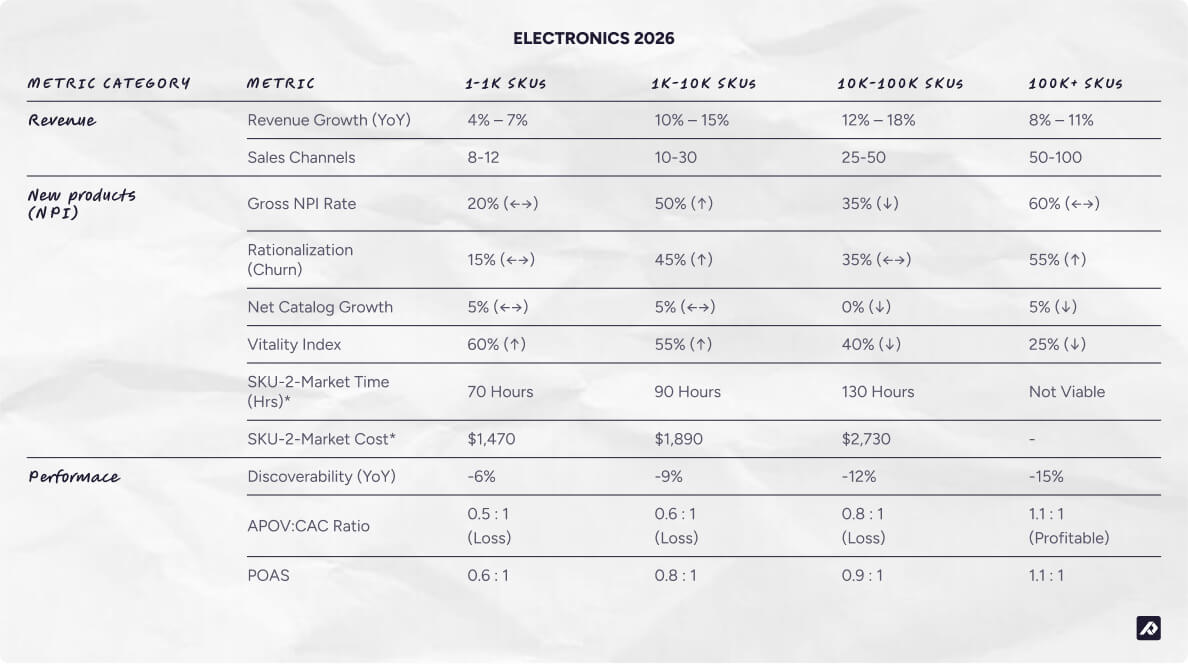
The following “Napkin” provides average commerce benchmarks across the Electronics vertical (Appliances, Gaming, Consumer Electronics, Computer, Mobile), segmented by catalog size (SKU count).
2. Introduction
How to use the Napkin
The Commerce Napkin is designed to be an “at-a-glance” benchmark tool based on stats analyzed over the past 12 months. By tracking your company’s key metrics against the derived medians in the table above, you can identify where your operations stand compared to the market average for your specific size. It serves as a diagnostic tool to pinpoint whether you are lagging, performing at par, or outperforming the market in terms of growth, efficiency, and product health.
electronic industries Defined
The Electronics vertical encompasses the following categories:
- Appliances: Includes major goods (such as fridges, washers, and dishwashers) and smaller appliances (such as blenders and coffee makers).
- Computing & IT: Laptops, monitors, and supporting devices.
- Gaming & Personal Tech: Flagship consoles, handhelds, and peripherals.
- Telephony & Mobile: Smartphone devices, tablets, and 5G-compatible hardware.
We have grouped these distinct verticals together because they share fundamental operational and market characteristics that differentiate them from other verticals. These shared dynamics include:
- High Catalog Velocity: Electronic products typically have compressed product lifecycles and high levels of standardization. Success is predicated on syncing accurate technical specifications across global channels before rapid innovation cycles render inventory obsolete.
- Technical Data & Channel Imperative: Products are defined by attribute-heavy technical specifications and complex relational data (compatibility mapping). The go-to-market (GTM) strategy relies heavily on high-speed channel syndication, price comparison engines, and winning the “Buy Box” on marketplaces.
- Standardization and Compliance Burden: The environment is defined by extreme standardization (e.g., GTIN/EAN) and a stringent regulatory focus on technical compliance to operate in major international markets.
Grouping them allows for the creation of meaningful, focused benchmarks, as seen in the Electronics Napkin, which accurately reflect the challenges and efficiencies specific to managing these types of product catalogs.
Definition of terms and metrics
- Velocity: The rate at which new SKUs are introduced, updated, or retired, reflecting how quickly assortments evolve due to seasonality, trends, and consumer demand. Hardline industries are characterized by lower seasonality, longer product lifecycles, and specification-driven complexity (e.g., Configuration/Compatibility/Performance attributes).
- Gross NPI: The raw count (or percentage) of new SKUs introduced in a period.
- Rationalization (Churn): The percentage of SKUs discontinued or archived.
- Vitality Index: The percentage of total revenue generated from products launched within the last year.
- SKU-2-Market: The time (labor hours) and cost (at $21/hr) required to enrich, format, and publish 100 SKUs to all active channels.
- APOV: CAC (First-Order Profitability Ratio):
- Definition: The ratio of Average Profit per Order Value (Gross Margin $) to Customer Acquisition Cost (CAC). It measures whether a brand makes money on the very first transaction with a new customer.
- Formula:

- Signal: A ratio below 1.0 implies the retailer relies on repeat purchases (LTV) to become profitable. A ratio of at least 1.0 indicates immediate profitability on the first sale.
- POAS (Profit on Ad Spend):
- Definition: A measure of advertising efficiency that focuses on bottom-line impact rather than top-line revenue. Unlike ROAS (Revenue / Ad Spend), POAS accounts for the Cost of Goods Sold (COGS) and other variable costs.
- Formula:

- Signal: A POAS greater than 1.0 indicates that marketing is generating net profit. A POAS of 2.0 or higher is generally considered healthy for scaling.
- Product Discoverability (Search & LLM Visibility):
- Definition: The estimated median number of times a brand’s products appear in monthly digital search results, comprising traditional Search Engine Results Pages (SERPs), Generative AI answers (LLMs like ChatGPT, Perplexity), and Marketplace Listings.
- Signal: High YoY growth indicates successful optimization for the new “Answer Engine” economy (AEO) alongside traditional SEO.
3. Analysis
The Shift from "Speed" to "Value"
In 2025, revenue growth in Electronics is no longer strictly correlated with raw SKU count or the simple ability to stock a product. A divergence has occurred: smaller players are driving revenue through specialization and technical superiority, while massive players are driving revenue by optimizing the “digital plumbing” and capturing secondary markets. The “middle” segments are seeing revenue growth primarily through value-added services and the effective management of product lifecycles.
1. Segment: 1 – 1,000 SKUs (DTC Tech & Audio Brands)
- Primary Revenue Driver: Brand Premium & Niche Performance
- Growth Mechanism:
- Technical Superiority Pricing: These companies generate high margins from products with specialized technical specifications (e.g., audiophile gear). By maintaining a narrow, high-performance catalog, they avoid “Buy Box” competition and secure full-price sell-through based on quality and brand story.
- Micro-Market Reach: High-value, low-volume products are easily exportable. Growth is achieved by quickly finding and activating niche global audiences via targeted digital ads, maximizing reach per SKU.
- Compatibility as Content: Revenue is protected by providing exhaustive compatibility lists and guides, which minimizes the “purchase doubt” that drives costly returns in this high-specification sector.
2. Segment: 1,000 – 10,000 SKUs (Specialized Distributors)
- Primary Revenue Driver: Value-Added Resale & Technical Compliance
- Growth Mechanism:
- Custom Configuration Uplift: These resellers capitalize on high-ticket custom upgrades (e.g., Gaming PCs, server builds). Revenue is generated by the value-add of assembly, testing, and pre-configuration, moving them beyond mere product distribution.
- Structured Data Excellence: Growth is achieved by maintaining superior technical data efficiency. Flawless structured data ensures products always rank highest in comparison engines and procurement searches, directly translating to market visibility and higher-margin B2B sales.
- Regulatory Access: By being compliant with complex, localized regulations, they gain exclusive access to channels that non-compliant competitors cannot serve.
3. Segment: 10,000 – 100,000 SKUs (Broadline Tech Retailers)
- Primary Revenue Driver: Lifecycle Capture & Cross-Sell Optimization
- Growth Mechanism:
- Secondary Market Capture: Revenue growth is significantly boosted by formalizing secondary channels. Refurbished and Open Box segments operate as distinct, profitable revenue streams, recycling inventory and avoiding markdown devaluation.
- Compatibility Mapping Automation: They leverage robust systems to automate complex cross-reference tables (e.g., “Which charger fits which device”). This unlocks massive revenue from suggestive selling, bundling, and accessory attachment rates that would otherwise be missed.
- Tech Cycle Acceleration: Growth is tied to their agility in capitalizing on macro trends. Their scale allows them to quickly onboard and syndicate the latest products from major manufacturers before smaller competitors.
4. Segment: 100,000+ SKUs (Global Distributors/Components)
- Primary Revenue Driver: API Infrastructure & Long-Tail Data Governance
- Growth Mechanism:
- Data-as-a-Service (DaaS): Revenue is increasingly driven by facilitating commerce for downstream partners. By providing API-driven “headless” connections, they serve as the central data repository for thousands of smaller retailers, effectively capturing a percentage of the total industry volume via data-as-a-service (DaaS) fees.
- Supplier Compliance Funnel: They leverage their scale to enforce strict attribute requirements on suppliers. By mandating high data density for all listings, they de-risk their own catalog and consolidate their position as the authoritative source for technical components, de-listing suppliers who fail to meet metadata standards.
- Sustainment Revenue: Revenue stability is ensured by stocking the “Long Tail” of spare parts and older components. Even after a product reaches End-of-Life (EOL), they generate consistent, high-margin revenue from maintenance, repair, and operations (MRO) buyers.

Profitability, Efficiency, and Discoverability by Segment
This part of the analysis breaks down how factors like first-order profitability (APOV:CAC), paid ad efficiency (POAS), and most critically, Product Discoverability, across the different segments clearly highlight the strategic shifts required for survival and growth in an AI-driven search landscape.
1. Segment: 1 – 1,000 SKUs (DTC Tech & Audio Boutique)
Explanation of Development:
- The First-Order Loss Paradox: The APOV:CAC Ratio of 0.50 (Critical Loss) highlights the extreme difficulty and expense of acquiring a customer in the technical electronics market. These DTC brands face a double squeeze: they pay the same high Customer Acquisition Cost (CAC) as large aggregators but lack the scale to absorb it. The resulting low POAS (0.60) indicates that paid channels are often unprofitable, forcing an immediate, unsustainable reliance on repeat purchases.
- The Data Integrity Wall: While the entire vertical faces a discovery downturn, this segment shows the highest resilience (-6%). This is the “Boutique Advantage”: with only 1,000 SKUs, these brands can maintain the near-perfect attribute accuracy required to pass through the increasingly strict filters of AI agents and comparison engines. While larger retailers struggle with data decay across massive catalogs, these specialists use high-resolution data to remain visible, even as the broader digital shelf shrinks.
2. Segment: 1,000 – 10,000 SKUs (Specialized Distributors)
Explanation of Development:
- The Lifetime Value Dependency: The APOV:CAC Ratio of 0.60 confirms that the business model is inherently structured for a loss on the first order. Specialized distributors are not selling impulse purchases; they are paying a high Customer Acquisition Cost (CAC) to onboard engineers, system integrators, and Value-Added Resellers (VARs). Profitability is entirely dependent on a high Customer Lifetime Value (CLV) from repeat, cyclical purchases of replacements and generational upgrades.
- The Technical Data Decay: Despite having a high baseline of monthly discoverability, the 9% YoY decline is a critical warning sign for a specialist. This erosion is driven by the industry’s need for extreme data accuracy. If the distributor’s technical product attributes (e.g., compatibility maps, exact component specs) are not perfectly structured and syndicated, their listings are being filtered out in increasingly complex B2B procurement systems and AI search engines, ceding traffic to more data-compliant aggregators.
- Generational Upgrade Squeeze: The high volume of “Generational Replacement & Upgrades” is intended to be the growth engine, but the low POAS (0.80) suggests that paid campaigns targeting these specific, high-intent keywords are being massively contested and are currently unprofitable. The distributor must shift from broad advertising to mastering organic search (SEO) and leveraging existing customer relationships for high-margin service and installation revenue to offset the critical acquisition loss.
3. Segment: 10,000 – 100,000 SKUs (Broadline Tech Retailers)
Explanation of Development:
- The Attachment-Rate Dependency: The APOV:CAC Ratio of 0.80 and POAS of 0.90 confirm that this segment operates on a “Loss Leader” model for primary hardware. These retailers are not banking on the margins of a single laptop or camera; they are paying to acquire customers to drive high-margin secondary revenue. Success is entirely dependent on Cross-Sell Optimization, leveraging scale to sell bundled accessories, extended warranties, and high-margin “Refurbished” or “Open Box” inventory to offset the initial acquisition loss.
- The Complexity Cliff in Data Syndication: Despite a high number of monthly searches, the 12% YoY decline highlights a failure to manage technical metadata scaling. This segment manages the second most complex catalog in the vertical, including intricate compatibility maps. The drop indicates that as global marketplaces and AI-led search engines demand real-time attribute precision, these retailers are suffering from Metadata Degradation, leading to their listings being filtered out when technical specs don’t perfectly align with increasingly rigid search requirements.
- Volume over Margin Strategy: The APOV:CAC Ratio of 0.80 and POAS of 0.90 confirm that this segment operates on a volume and cross-selling model. They pay a loss on the initial purchase because they rely on their massive scale and customer data to drive profitable secondary revenue through bundled accessories, services, and high-margin “Refurbished” and “Open Box” channels.
4. Segment: 100,000+ SKUs (Global Distributors/Components)
Explanation of Development:
- The Scale-Driven Profit Engine: The APOV:CAC Ratio of 1.10 confirms that this is the only segment in Electronics that is structurally profitable on the first transaction. This is achieved through their extreme scale, which dilutes operational costs, and by leveraging B2B revenue from API-driven and EDI-integrated supply chains
- The Data Governance Shift: The massive 15% decline in Discoverability is the greatest operational challenge. While this segment has high monthly appearances, this decline is a direct result of managing the industry’s highest attribute density. With the rise of AI search engines, failure to perfectly govern this master data results in non-compliant product listings being automatically suppressed or filtered out by channel algorithms.
- API as a Channel Strategy: To maintain their “Digital Scale Leadership,” this segment is shifting focus from simply selling products to optimizing their commerce infrastructure. Revenue stability is secured by maintaining massive distributor networks and API-driven “headless” commerce connections, essentially becoming the authoritative, trusted data source for other, smaller players in the ecosystem. Their sheer size creates a barrier to entry, forcing competitors to rely on them for component supply and long-tail inventory.
Conclusion: The Electronics Commerce Divergence (2025)
The Electronics commerce landscape in 2025 is defined by a fundamental shift from achieving growth through “Speed” (simple product drops) to “Value” (structured data and secondary lifecycle monetization). Revenue growth is driven by distinct mechanisms for each segment:
- First-Order Profitability (APOV:CAC): The majority of the vertical is in a state of loss (ratios 0.5–0.8), with the 100K+ segment being the only one holding a structural profit moat (1.1) due to extreme scale and B2B supply chain integration.
- Discoverability: The vertical has hit a sector-wide discoverability wall (declines of -6% to -15%), with massive giants seeing the sharpest drops. Success depends on providing the high-resolution, structured attributes required by AI search agents.
- The Profitability Gap: Mid-market players are caught in a “Dangerous Middle,” where high NPI activity and aggressive rationalization are currently failing to counteract declining organic visibility and unprofitable first-order transactions. The sector is in a state of “Profitability Divergence.” Large aggregators are the only ones holding a profit moat, while mid-market and boutique players face a critical need to improve Lifetime Value to survive declining organic discoverability and rising CAC.
4. Outliers
While market averages point to declining profitability and growing operational friction, a distinct group of Electronics outliers is breaking the pattern. These companies consistently outperform the Napkin benchmarks by mastering data velocity and technical integrity.
Outliers excel across many dimensions, but our analysis focuses on the areas where the gap is widest and where we believe growth is most directly influenced:
- Velocity & Growth: They achieve double-digit growth even at scale by accelerating Time-to-Market (TTM), ensuring new products are fully syndicated to all channels (from component marketplaces to B2C retail) before they become obsolete. This speed is the critical defense against rapid product churn.
- APOV:CAC: They achieve first-order profitability earlier by drastically reducing returns caused by technical confusion or incompatibility, relying on flawless compatibility mapping and detailed specs. This data integrity also increases basket size by enabling automated and highly accurate cross-selling of accessories, upgrades, and necessary components.
- SKU-2-Market Efficiency: They reduce the time to enrich and syndicate products from weeks to hours. This is achieved by automating the gathering and standardization of hundreds of technical attributes and compliance data required by global comparison engines and marketplaces.
- Discoverability: They maintain or grow organic visibility by having richer, perfectly structured technical data that not only wins the “Buy Box” on marketplaces but also effectively feeds comparison shopping engines and Answer Engine algorithms (LLMs), ensuring their products are the technical choice in filtered searches.
1. A Connected Tech-Stack
Another key differentiator is how the tech stack is architected.
The average company operates in silos. Product data lives in spreadsheets, assets sit in shared drives, and ERPs are loosely or not at all connected to sales channels. This fragmentation creates friction, errors, and time drains that slow down new product introductions.
The outliers we’ve analyzed all have a tech-stack that is connected through a PIM or a custom-built data warehouse that acts as a single source of truth. This unlocks two critical advantages:
- Effective Use of AI
AI cannot perform on fragmented data. Outliers apply AI on top of structured PIM data to automate enrichment, translation, and tagging, cutting SKU-to-market time by more than 90 percent. - Automated Syndication
Instead of manually updating all internal data-sources and sales-channels, the outliers have everything connected and synced. This way, product data is updated almost in real-time everywhere, ensuring speed, consistency, and accuracy at scale.
2. Strategic Focus on Content-Led Growth
Another major trend that sets the outliers apart is that they have all implemented a content-led growth (CLG) strategy. Instead of treating SEO, PLO (Product Listing Optimization), and similar acronyms as isolated tactics, CLG brings them together under a single, coherent approach.
At its core, CLG is about clear branding, strong communication guidelines, and a systematic way of structuring and optimizing product content. These companies treat product information as a strategic asset, not an operational burden. The result is products that effectively sell themselves through better data, stronger visuals, and faster, more consistent availability across every channel.
Consumer Products Report 2025. Bain & Company (2025).
https://www.bain.com/insights/consumer-products-report-2025-reclaiming-relevance-in-the-gen-ai-era/
Consumer Electronics Semiconductor Market. Mordor Intelligence (2025).
https://www.mordorintelligence.com/industry-reports/semiconductor-device-market-in-consumer-industry
Consumer Electronic Trends 2025. Shopify Enterprise (2025).
https://www.shopify.com/enterprise/blog/consumer-electronic-trends
Gartner Predicts Search Engine Volume Will Drop 25% by 2026, Due to AI Chatbots and Other Virtual Agents. Gartner (2025).
https://www.gartner.com/en/newsroom/press-releases/2024-02-19-gartner-predicts-search-engine-volume-will-drop-25-percent-by-2026-due-to-ai-chatbots-and-other-virtual-agents
Social commerce share of e-commerce sales worldwide. Statista (2025).
https://www.statista.com/statistics/1251145/social-commerce-share-worldwide/
2025 Digital Success Metrics Benchmarks. Forrester (2025).
https://www.forrester.com/report/2025-digital-success-metrics-benchmarks-by-industry/RES190395