
2026 Commerce Napkin – Industrial
1. The Napkin
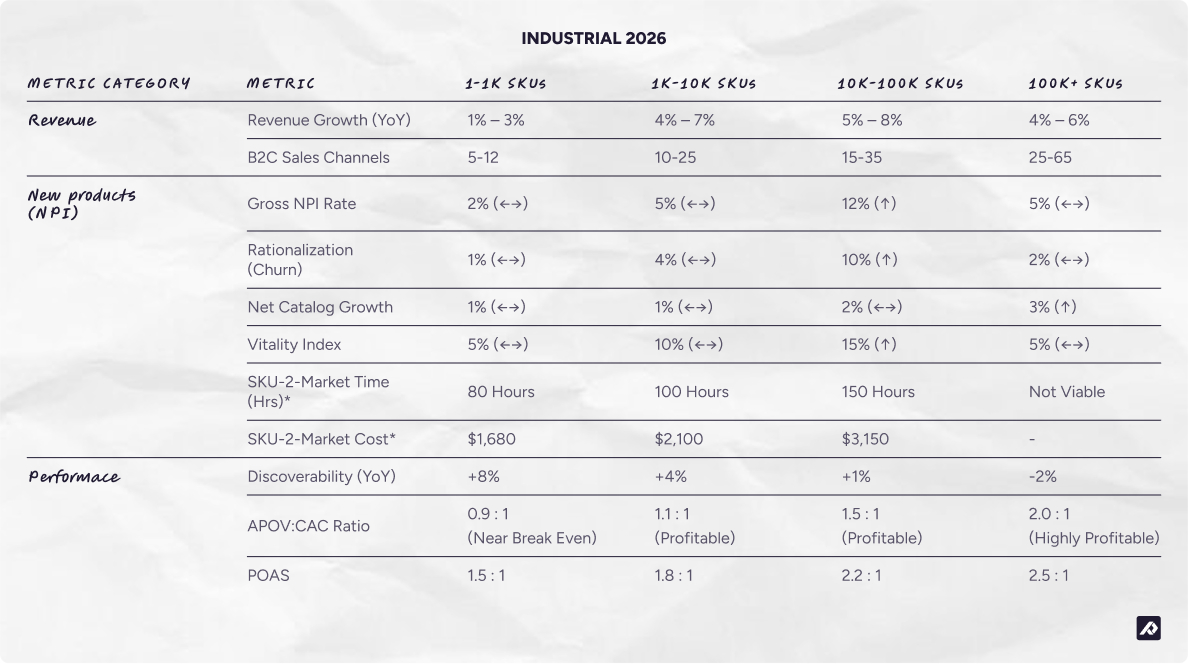
The following “Napkin” provides average commerce benchmarks across the Industrial vertical (Automotive, Equipment, MRO, Medical, and Building Materials), segmented by catalog size (SKU count).
2. Introduction
How to use the Napkin
The Commerce Napkin is designed to be an “at-a-glance” benchmark tool based on stats analyzed over the past 12 months. By tracking your company’s key metrics against the derived medians in the table above, you can identify where your operations stand compared to the market average for your specific size. It serves as a diagnostic tool to pinpoint whether you are lagging, performing at par, or outperforming the market in terms of growth, efficiency, and product health.
What sectors are considered Industrial: Industrial Verticals Defined
The Industrial vertical encompasses the following sectors:
- Manufacturing & Components: Raw materials, electronic components, precision tools, pumps, valves, and fasteners.
- MRO (Maintenance, Repair, & Operations): Consumables, safety equipment, industrial supplies, and spare parts.
- OEM (Original Equipment Manufacturer) & Automotive: Suppliers of critical parts to large-scale assembly lines (e.g., aerospace, auto-parts).
- Broadline Distribution: Aggregators and distributors managing millions of parts for various industries.
We have grouped these distinct sectors together because they share fundamental operational and market characteristics that differentiate them from other verticals like softline (e.g., apparel, accessories) or CPG (e.g., food, beauty). These shared dynamics include:
- Low Catalog Velocity: Industrial catalogs change infrequently, as products are designed for long lifecycles, tight specifications, and backward compatibility, with replacements occurring mainly due to standards changes or end-of-life components.
- Extreme Data Density Imperative: The sector is defined by high attribute densit , as products are described by technical specifications, rather than adjectives. This requires that digital product data be fully structured to allow buyers and search engines to use complex filters for procurement.
- System-Integrated B2B Procurement: The Go-to-Market (GTM) model is transitioning from legacy relational selling to digitized procurement integration. The GTM mix is a complex orchestration of automated “Punch-out” catalogs (SAP/ERP integration), specialized vertical marketplaces, and proprietary dealer portals that lock in long-term B2B contracts
- Standards-Based Compliance Landscape: The overarching regulatory environment is focused on adherence to multiple technical classification standards (e.g., ETIM, UNSPSC, eCl@ss), as well as physical compliance (ISO, DIN, ANSI). Supporting these standards simultaneously is critical for trading with different partners and securing B2B contracts.
Grouping them allows for the creation of meaningful, focused benchmarks, as seen in the Industrial Napkin, which accurately reflect the challenges and efficiencies specific to managing these product catalog types.
Definition of terms and metrics
- Velocity: The rate at which new SKUs are introduced, updated, or retired, reflecting how quickly assortments evolve due to seasonality, trends, and consumer demand. Hardline industries are characterized by lower seasonality, longer product lifecycles, and specification-driven complexity (e.g., Configuration/Compatibility/Performance attributes).
- Gross NPI: The raw count (or percentage) of new SKUs introduced in a period.
- Rationalization (Churn): The percentage of SKUs discontinued or archived.
- Vitality Index: The percentage of total revenue generated from products launched within the last year.
- SKU-2-Market: The time (labor hours) and cost (at $21/hr) required to enrich, format, and publish 100 SKUs to all active channels.
- APOV: CAC (First-Order Profitability Ratio):
- Definition: The ratio of Average Profit per Order Value (Gross Margin $) to Customer Acquisition Cost (CAC). It measures whether a brand makes money on the very first transaction with a new customer.
- Formula:

- Signal: A ratio below 1.0 implies the retailer relies on repeat purchases (LTV) to become profitable. A ratio of at least 1.0 indicates immediate profitability on the first sale.
- POAS (Profit on Ad Spend):
- Definition: A measure of advertising efficiency that focuses on bottom-line impact rather than top-line revenue. Unlike ROAS (Revenue / Ad Spend), POAS accounts for the Cost of Goods Sold (COGS) and other variable costs.
- Formula:

- Signal: A POAS greater than 1.0 indicates that marketing is generating net profit. A POAS of 2.0 or higher is generally considered healthy for scaling.
- Product Discoverability (Search & LLM Visibility):
- Definition: The estimated median number of times a brand’s products appear in monthly digital search results, comprising traditional Search Engine Results Pages (SERPs), Generative AI answers (LLMs like ChatGPT, Perplexity), and Marketplace Listings.
- Signal: High YoY growth indicates successful optimization for the new “Answer Engine” economy (AEO) alongside traditional SEO.
3. Analysis
The Shift from "Catalog" to "Data-Driven"
In 2025, revenue growth in the Industrial sector is no longer determined by simple relational selling or stocking volume, but by the ability to structure complex engineering data for digital procurement. A significant divergence has emerged: boutique manufacturers are winning the battle for AI-led discovery through data precision, while mid-market partners drive revenue through reshoring and innovation. National giants, meanwhile, have built a digital moat through “Endless Assortment” and long-tail maintenance capture, though they face a growing discovery wall as their catalogs reach peak complexity.
1. Segment: 1 – 1,000 SKUs (Niche Manufacturers)
- Primary Revenue Driver: Brand Premium & Niche Performance
- Growth Mechanism:
- Agentic Sourcing Discovery: Boutique suppliers are the discoverability leaders (+8%) in 2025. As AI sourcing agents seek specific engineering specifications, these niche brands are cited more frequently than generic aggregators because they provide the vertical’s highest-resolution technical data.
- The “Installed Base” Lock-in: By preserving specialized catalogs, manufacturers support their clients’ installed base through long-term service contracts. These critical-path parts are functionally “locked in” by regulatory and engineering specifications, ensuring high-margin, non-discretionary revenue streams that are immune to typical market volatility.
- Near-Break-Even Efficiency: While still reaching for profitability (0.9 ratio), they target high-intent long-tail queries efficiently (1.5 POAS), focusing marketing spend on “fit-specific” keywords rather than broad categories.
2. Segment: 1,000 – 10,000 SKUs (Mid-Sized Components)
- Primary Revenue Driver: Depth Over Width (Curated Hubs)
- Growth Mechanism:
- Specialist Hub Strategy: These players achieve 4%–7% growth by protecting their niche through extreme product depth (e.g., every thread pitch of a specific high-tensile fastener) rather than catalog breadth. This expertise earns them “Preferred Vendor” status in specialized procurement portals.
- Project-Based Attributes: By introducing “Project” attributes (mapping tool compatibility and coverage areas), they assist contractors in making “considered” purchases. This high-quality contextual data has pushed them across the profit threshold (1.1 ratio) by reducing compatibility-related returns.
- B2B Self-Service: Revenue is scaled through “Punch-out” capabilities, which allow for the direct integration of the distributor’s deep inventory into the client’s internal ERP environment, automating the self-service procurement process.
3. Segment: 10,000 – 100,000 SKUs (OEM Suppliers)
- Primary Revenue Driver: Reshoring & Global Standardization
- Growth Mechanism:
- Reshoring Capture: As the vertical’s most innovative segment (15% Vitality Index), these players capitalize on the regionalization of manufacturing across North America and Europe. They capture high-margin demand by provisioning the complex MRO requirements of “Smart Factories,” where uptime is tied to the immediate availability of precision-engineered components.
- Standardization Agility: They maintain high profitability (1.5:1 ratio) by supporting multiple classification standards (ETIM, UNSPSC, eCl@ss) simultaneously. This allows them to trade effortlessly with global assembly lines that have divergent data requirements.
- One-Stop-Shop Consolidation: As buyers consolidate vendors to reduce supply chain friction, these mid-market leaders capture revenue by offering value-added services like digital maintenance logs and “vending machine” inventory management.
4. Segment: 100,000+ SKUs (Broadline Distributors)
- Primary Revenue Driver: Scalable Catalog Coverage and Long-Tail Capture
- Growth Mechanism:
- Commission over Inventory (Dropship): Giants act as the “Amazon of Industry,” onboarding entire supplier catalogs digitally without taking inventory risk. This extended catalog model allows them to capture “tail spend” queries at near-zero organic CAC.
- Sustainment Revenue: They generate consistent, high-margin revenue by warehousing the “Long Tail” of spare parts for End-of-Life (EOL) equipment. Their structural profit moat (2.0 ratio) is built on proprietary availability; they act as the sole source for legacy components that are no longer supported by original manufacturers.
- Answer Engine Moat: Even with a -2% decline in organic search discoverability, their extreme data density ensures they remain the primary reference source for generative AI agents. Profitability is insulated by shifting acquisition spend toward EDI-based supply chain integrations, leveraging technical “lock-in” to minimize customer churn.

Profitability, Efficiency, and Discoverability by Segment
1. Segment: 1 – 1,000 SKUs (Niche Manufacturers)
Explanation of Development:
- The Efficiency Signal: The APOV:CAC Ratio of 0.90 and strong POAS of 1.50 indicate a move toward a high-value, contract-driven B2B profitability model. Unlike consumer brands, this segment’s rising efficiency is not from lower advertising costs but from the inherent high value of their specialized parts, leading to immediate or near-immediate profitability on the first transaction.
- Data-Driven Procurement Access: The 8% growth in Discoverability is driven by success in distributing deep structured technical data across niche B2B marketplaces and direct digital sales channels. Visibility is gained not through mass-market search, but by perfectly matching an engineer’s complex, filtered query via accurate attributes.
- The Core Contract Mechanism Revenue stability is built on Engineering Spec Stability. Having complete, detailed attributes for all products is non-negotiable. The sales process is about proving the product data integrity (e.g., CAD files, compliance docs) to secure the high-value, long-term B2B and OEM contracts that form the foundation of their business.
2. Segment: 1,000 – 10,000 SKUs (Mid-Sized Components)
Explanation of Development:
- High-Efficiency Profit Mode: The high APOV:CAC Ratio of 1.10 and a strong POAS of 1.80 confirm that this segment runs an exceptionally efficient and healthy B2B commerce model. They are succeeding by specializing (“Depth over Width”) and avoiding the costly, generalized ad competition of broader markets, focusing their budget on channels with high buyer intent.
- Curated Digital Hubs: The 4% growth in Discoverability highlights that success is not based on mass-market volume but on becoming a trusted, curated source. This is achieved by mastering the syndication of complex attributes to key industry procurement platforms, where technical accuracy is valued over price.
- Strategic Channel Focus: Profitability is secured by optimizing integration with distribution partners and by running highly-targeted B2B portals. Using technical data to facilitate the creation of “Project” bundles increases the Average Order Value (AOV), which is the core driver of their improved profitability metrics.
3. Segment: 10,000 – 100,000 SKUs (OEM Suppliers)
Explanation of Development:
- High-Margin Contract Efficiency: The strong APOV:CAC Ratio of 1.50 and high POAS of 2.20 confirm that this segment runs the most efficient commerce operation in the Industrial sector. This profitability is driven by high-value, long-term Global Supply Partnering with large original equipment manufacturers (OEMs). Revenue is guaranteed by the contractual nature of the sales cycle, which minimizes the Customer Acquisition Cost (CAC) and optimizes ad spending.
- The Reshoring Benefit: The +0.05 increase in APOV:CAC is a clear indicator of the financial benefit from the Reshoring trend. As supply chains move closer to the point of assembly, this segment is seeing higher order values and more stable contracts, resulting in improved revenue and margin.
- Data Standards for Access: The discoverability growth shows a stable online presence. This scale is achieved by mastering Data Standards Compliance. To trade with global partners, they must support multiple classification standards (ETIM, UNSPSC, eCl@ss) simultaneously. Perfect data hygiene is the single key to integrating into customer ERPs via Punch-out implementations, which secures their position as a preferred vendor.
- Consolidation and Trust: The positive trend across all metrics confirms that buyers prefer these ‘one-stop-shop’ mid-market distributors. Their efficiency and size solidify their role as critical partners in global supply chains.
4. Segment: 100,000+ SKUs (Broadline Distributors)
Explanation of Development:
- The Apex of B2B Profitability: The median APOV:CAC Ratio of 2.00 represents the strongest unit economics in the vertical. This efficiency is achieved through their focus in B2B Channels, where the high Average Order Value (AOV) of MRO and bulk contractor sales far outweighs the cost of acquisition. Their profitability is secured by a highly automated supply chain and EDI integrations that minimize transaction overhead.
- The Scale Penalty: Despite the high profitability, the decline in Discoverability is a direct consequence of their massive scale. The sheer volume of their catalog means managing the most complex data models in commerce. A small percentage of data errors can lead to millions of listings being filtered out, leading to a large drop in total digital footprint.
Conclusion: The Industrial Commerce Divergence (2025)
The Industrial commerce landscape in 2025 is defined by a divergence between profitability at scale and agility in discovery. While large-scale aggregators maintain a structural profit moat, small manufacturers are leading in AI-driven discoverability through data precision. Future revenue growth depends on closing the “Attribute Gap” between legacy ERP data and modern digital procurement standards.
- First-Order Profitability (APOV:CAC): The vertical is uniquely profitable, with all segments above 1,000 SKUs seeing returns on the first sale. Small manufacturers are leveraging niche specs to reach near break-even (0.9) despite long buying cycles.
- Discoverability: A reversal has occurred where massive players are hitting a discovery ceiling (-2%), while the smallest, highly specialized manufacturers are seeing the highest growth (+8%) in the “Answer Engine” economy.
- The Attribute Gap: Mid-market players (10K–100K SKUs) are the primary innovators, using high-speed data automation to bridge the gap between legacy PDF specs and structured digital procurement needs.
4. Outliers
While market averages point to digital lag and growing data complexity, a distinct group of Industrial outliers is breaking the pattern. These companies consistently outperform the Napkin benchmarks by mastering the digital procurement lifecycle, treating data integrity as a guaranteed revenue stream.
Outliers excel across many dimensions, but our analysis focuses on the areas where the gap is widest and where we believe growth is most directly influenced, using the Industrial vertical’s core operational metrics:
- Growth: They achieve a superior Vitality Index and double-digit growth at scale by accelerating Gross NPI (new specialized components) and minimizing the time-to-contract for high-value B2B deals. Their speed is the ability to instantly prove product compatibility and compliance for any new supply chain requirement.
- First-Order Profitability (APOV:CAC): They consistently maintain a positive APOV:CAC ratio by ensuring flawless technical data integrity to virtually eliminate costly human-error-driven returns or incorrect orders. This focus also drives a higher AOV by facilitating sophisticated, multi-part “project” and system bundles.
- SKU-2-Market Efficiency: They reduce the time to launch products from weeks to hours by automating the highly complex process of normalizing their product data against multiple classification standards.
- Discoverability: They drive high YoY growth in Product Discoverability by having the richest and most structured data in the industry, enabling them to win Answer Engine battles for the highly-filtered technical queries initiated by engineers and AI-powered procurement bots.
1. A Connected Tech-Stack
Another key differentiator is how the tech stack is architected.
The average company operates in silos. Product data lives in spreadsheets, assets sit in shared drives, and ERPs are loosely or not at all connected to sales channels. This fragmentation creates friction, errors, and time drains that slow down new product introductions.
The outliers we’ve analyzed all have a tech-stack that is connected through a PIM or a custom-built data warehouse that acts as a single source of truth. This unlocks two critical advantages:
- Effective Use of AI
AI cannot perform on fragmented data. Outliers apply AI on top of structured PIM data to automate enrichment, translation, and tagging, cutting SKU-to-market time by more than 90 percent. - Automated Syndication
Instead of manually updating all internal data-sources and sales-channels, the outliers have everything connected and synced. This way, product data is updated almost in real-time everywhere, ensuring speed, consistency, and accuracy at scale.
2. Strategic Focus on Content-Led Growth
Another major trend that sets the outliers apart is that they have all implemented a content-led growth (CLG) strategy. Instead of treating SEO, PLO (Product Listing Optimization), and similar acronyms as isolated tactics, CLG brings them together under a single, coherent approach.
At its core, CLG is about clear branding, strong communication guidelines, and a systematic way of structuring and optimizing product content. These companies treat product information as a strategic asset, not an operational burden. The result is products that effectively sell themselves through better data, stronger visuals, and faster, more consistent availability across every channel.
Consumer Products Report 2025. Bain & Company (2025). https://www.bain.com/insights/consumer-products-report-2025-reclaiming-relevance-in-the-gen-ai-era/
Future of Sales 2025: Deliver the Digital Options B2B Buyers Demand. Gartner (2025). https://www.gartner.com/en/newsroom/press-releases/2020-09-15-gartner-says-80–of-b2b-sales-interactions-between-su
Gartner Predicts Search Engine Volume Will Drop 25% by 2026, Due to AI Chatbots and Other Virtual Agents. Gartner (2025). https://www.gartner.com/en/newsroom/press-releases/2024-02-19-gartner-predicts-search-engine-volume-will-drop-25-percent-by-2026-due-to-ai-chatbots-and-other-virtual-agents
Global B2B Pulse: How B2B Winners Grow in 2025. McKinsey & Company (2025). https://www.mckinsey.com/capabilities/growth-marketing-and-sales/our-insights/seven-tests-for-b2b-growth
Industrial Ecommerce: A Guide for B2B Manufacturers 2025. Shopify Enterprise (2025). https://www.shopify.com/za/enterprise/blog/industrial-ecommerce
United States Maintenance, Repair, and Operations (MRO) Market. Mordor Intelligence (2025). https://www.mordorintelligence.com/industry-reports/united-states-maintenance-repair-and-operations-mro-market