
2026 Commerce Napkin – Softline
1. The Napkin
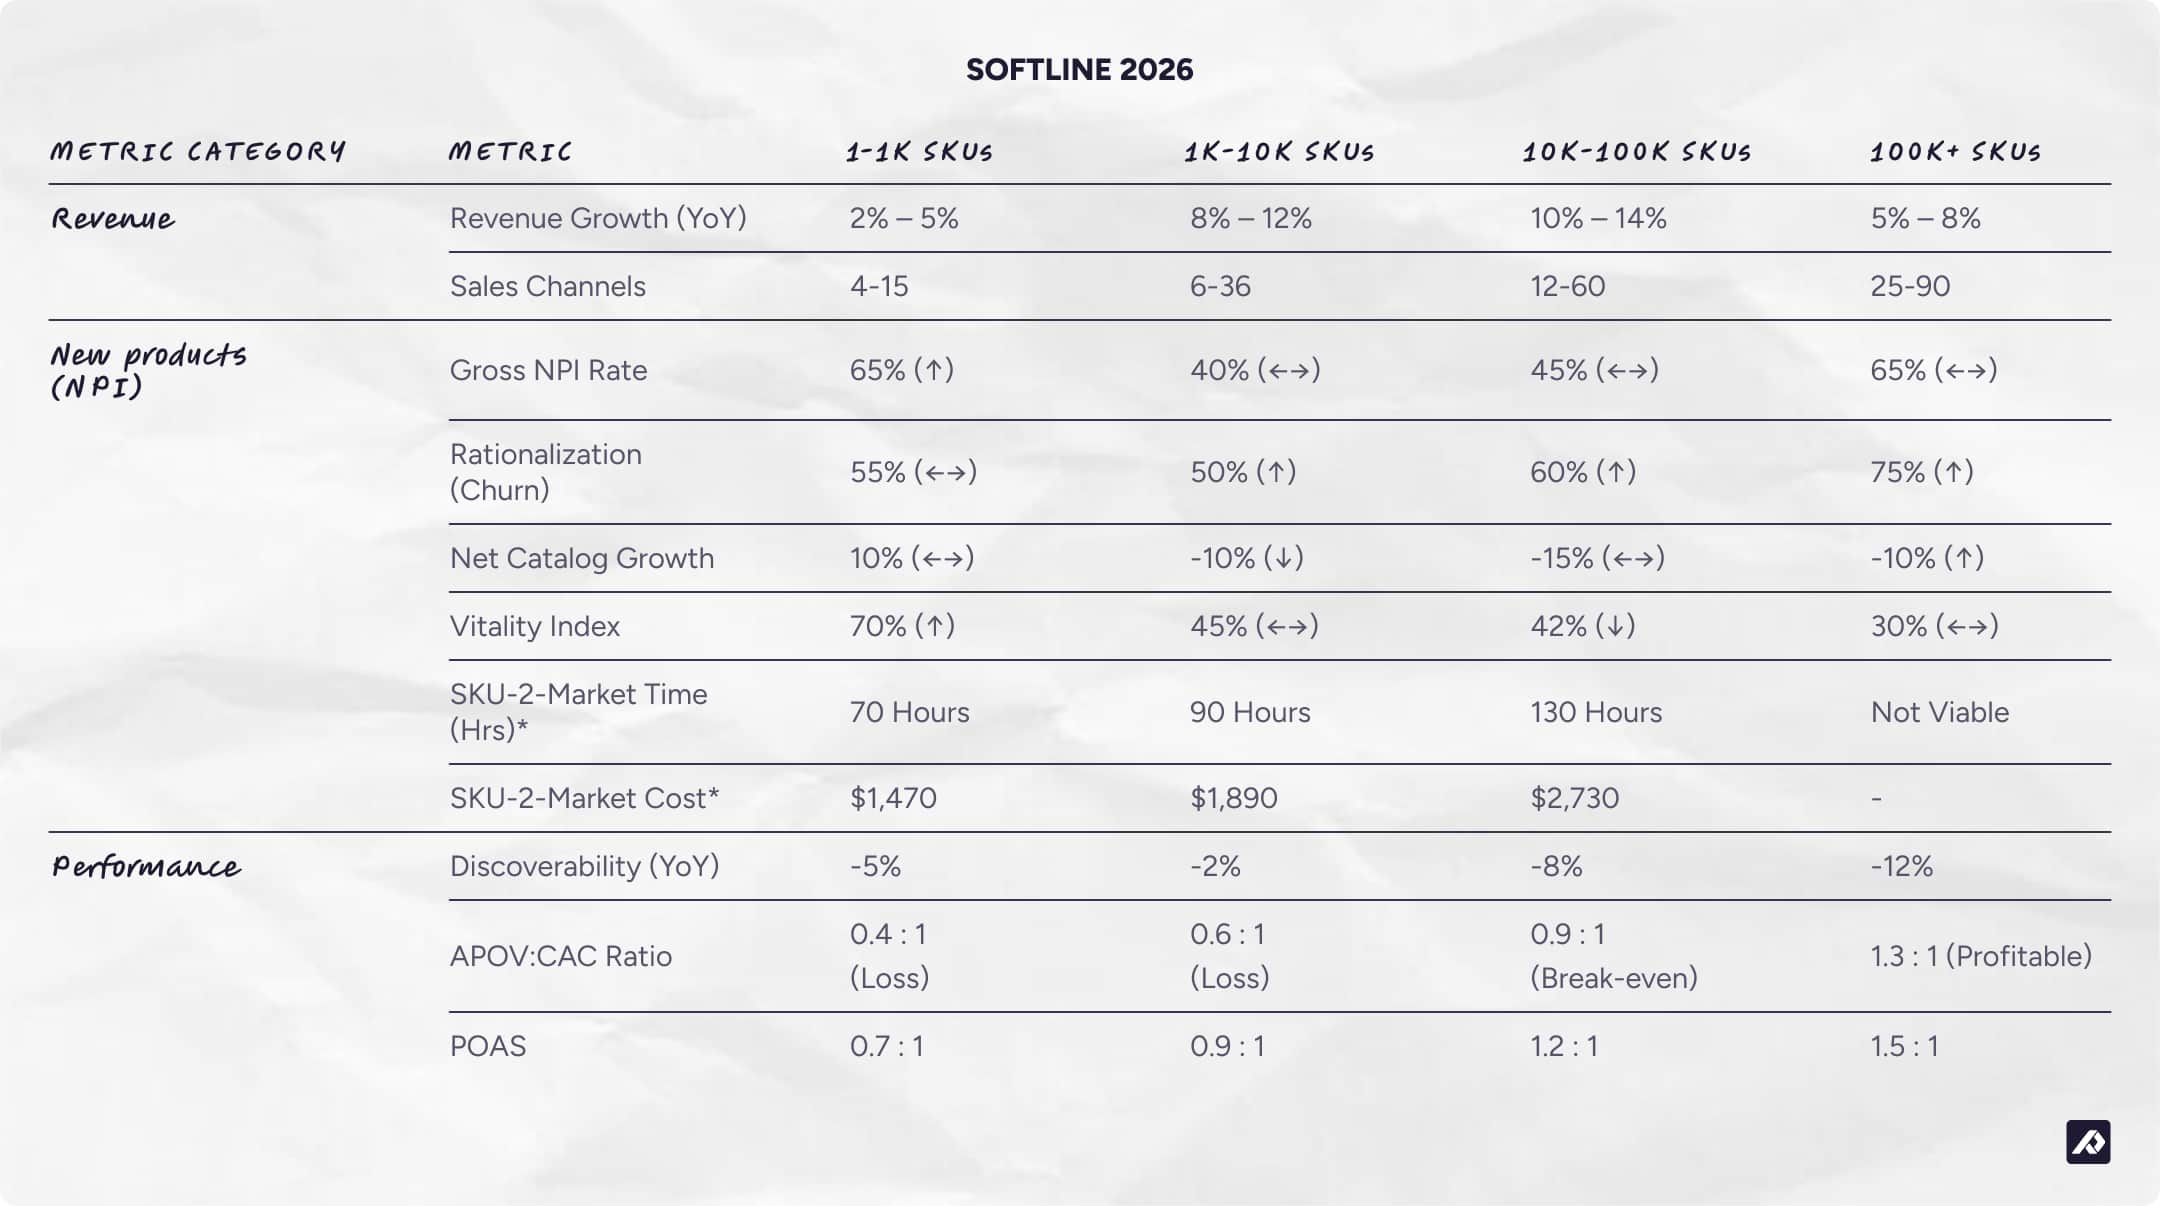
The following “Napkin” provides average commerce benchmarks across the Softline vertical (Apparel, Footwear, Accessories, Home Textile), segmented by catalog size (SKU count).
2. Introduction
How to use the Napkin
The Commerce Napkin is designed to be an “at-a-glance” benchmark tool based on stats analyzed over the past 12 months. By tracking your company’s key metrics against the derived medians in the table above, you can identify where your operations stand compared to the market average for your specific size. It serves as a diagnostic tool to pinpoint whether you are lagging, performing at par, or outperforming the market in terms of growth, efficiency, and product health.
What industries are considered softline: softline Industries Defined
The Softline vertical encompasses the following categories:
- Apparel: Core basics (t-shirts, underwear, socks, pants), children & baby clothing (onesies, kids’ schoolwear), and activewear / technical (yoga pants, running shorts).
- Footwear: Functional / work (work and school boots, orthopedical) and daily wear and sneakers (hype sneakers, heels, seasonal boots).
- Accessories: Fashion accessories (handbags, belts, hats, scarves), eyewear (sunglasses, optical frames), and jewelry.
- Home Textile: Soft home goods (bedding, towels, curtains, rugs).
- Luggage: Travel goods (suitcases, backpacks, duffles).
We have grouped these distinct verticals together because they share fundamental operational and market characteristics that differentiate them from other verticals like hardline (e.g., electronics, furniture) or CPG (e.g., food, beauty). These shared dynamics include:
- High Catalog Velocity: All Softline industries are characterized by high seasonality and trend-driven product lifecycles. They require frequent New Product Introduction (NPI) and high rationalization (churn) rates to manage inventory and respond to fast-moving consumer tastes.
- Similar Go-to-Market (GTM) Dynamics: Both products have complex variants (size, color, fit) and need strong visual and descriptive content for sales. Their GTM mix includes D2C ecommerce, third-party marketplaces, and B2B wholesale.
- Uniform Regulatory Landscape: While specific compliance rules vary, the overarching regulatory environment concerning material sourcing, labeling (e.g., care instructions, composition), and ethical manufacturing practices is largely consistent across these categories, requiring similar data governance and transparency.
Grouping them allows for the creation of meaningful, focused benchmarks, as seen in the Softline Napkin, which accurately reflect the challenges and efficiencies specific to managing these types of product catalogs.
Definition of terms and metrics
- Velocity: The rate at which new SKUs are introduced, updated, or retired, reflecting how quickly assortments evolve due to seasonality, trends, and consumer demand.
- Gross NPI: The raw count (or percentage) of new SKUs introduced in a period.
- Rationalization (Churn): The percentage of SKUs discontinued or archived.
- Vitality Index: The percentage of total revenue generated from products launched within the last year.
- SKU-2-Market: The time (labor hours) and cost (at $21/hr) required to enrich, format, and publish 100 SKUs to all active channels.
- APOV: CAC (First-Order Profitability Ratio):
- Definition: The ratio of Average Profit per Order Value (Gross Margin $) to Customer Acquisition Cost (CAC). It measures whether a brand makes money on the very first transaction with a new customer.
- Formula:

- Signal: A ratio below 1.0 implies the retailer relies on repeat purchases (LTV) to become profitable. A ratio of at least 1.0 indicates immediate profitability on the first sale.
- POAS (Profit on Ad Spend):
- Definition: A measure of advertising efficiency that focuses on bottom-line impact rather than top-line revenue. Unlike ROAS (Revenue / Ad Spend), POAS accounts for the Cost of Goods Sold (COGS) and other variable costs.
- Formula:

- Signal: A POAS greater than 1.0 indicates that marketing is generating net profit. A POAS of 2.0 or higher is generally considered healthy for scaling.
- Product Discoverability (Search & LLM Visibility):
- Definition: The estimated median number of times a brand’s products appear in monthly digital search results, comprising traditional Search Engine Results Pages (SERPs), Generative AI answers (LLMs like ChatGPT, Perplexity), and Marketplace Listings.
- Signal: High YoY growth indicates successful optimization for the new “Answer Engine” economy (AEO) alongside traditional SEO.
3. Analysis
The Shift from "More" to "Better"
In 2025, revenue growth in Softlines is no longer strictly correlated with catalog size. A divergence has occurred: smaller players are driving revenue through scarcity and price integrity, while massive players are driving revenue through digital aggregation and service fees. The “middle” segments are seeing revenue growth primarily through margin protection (selling fewer, better items) rather than pure volume expansion.
1. Segment: 1 – 1,000 SKUs (Boutique & DTC Brands)
- Primary Revenue Driver: High-Vitality Scarcity
- Growth Mechanism:
-
- Full-Price Sell-Through: With a high Vitality Index (55%), these companies generate the majority of their revenue from products less than 3 years old. By keeping SKU counts low, they create artificial scarcity. This allows them to sell a higher percentage of inventory at full price, avoiding the margin-crushing discount cycles that plague larger retailers.
- Full-Price Sell-Through: With a high Vitality Index (55%), these companies generate the majority of their revenue from products less than 3 years old. By keeping SKU counts low, they create artificial scarcity. This allows them to sell a higher percentage of inventory at full price, avoiding the margin-crushing discount cycles that plague larger retailers.
- Customer Lifetime Value (CLV): By maintaining a high churn rate (35%) on failed experiments, they ensure the catalog always feels “fresh,” driving repeat visits from loyal customers without requiring a massive marketing budget.
2. Segment: 1,000 – 10,000 SKUs (Mid-Market Chains)
- Primary Revenue Driver: Inventory Efficiency (Rationalization)
- Growth Mechanism:
-
- Width Rationalization: These companies experienced “growth by shrinking.” By cutting the number of color/size variants (e.g., stopping the production of the 4 worst-selling colors of a t-shirt), they reduced working capital tied up in slow-moving stock. This capital was reinvested into deeper stock of the best-sellers, preventing out-of-stocks on key items.
- Return Reduction: A major revenue leak in Softlines is returns (often 30%+). By rationalizing SKUs with complex fit profiles or high return rates, these companies effectively increased their net revenue even if gross sales remained flat.
- Core Focus: Revenue stability is anchored in “Never Out of Stock” (NOOS) basics. Growth comes from incrementally increasing the price of these core items (inflation pass-through) rather than chasing risky seasonal trends.
3. Segment: 10,000 – 100,000 SKUs (Department Stores & Large Specialty)
- Primary Revenue Driver: Clearance Velocity & Category Rotation
- Growth Mechanism:
-
- Markdown Management: This segment struggles with “Innovation Fatigue” (Vitality Index ~42%). Revenue growth is often volume-driven, relying on aggressive promotional calendars to clear massive amounts of seasonal inventory.
- The “Store-as-Warehouse” Model: Revenue is increasingly driven by Omnichannel capabilities, using physical store inventory to fulfill online orders. This unlocks “trapped” inventory that would otherwise sit unsold in a local store, effectively boosting the revenue yield per SKU.
- Strategic Retreat: To counteract negative trends in catalog growth, one strategic approach is to exit underperforming categories. This often results in improved revenue “growth” by allowing a focus on core, profitable areas. For example, discontinuing a private label shoe line could allow for a pure focus on apparel.
4. Segment: 100,000+ SKUs (Marketplaces & Aggregators)
- Primary Revenue Driver: Long-Tail Aggregation & Services
- Growth Mechanism:
-
- Commission over Inventory: Unlike the other segments, these players generate revenue growth without taking inventory risk. Their growth comes from onboarding more third-party sellers. Every new seller brings their own SKUs, expanding the “Endless Aisle” and attracting niche customers that a standard retailer cannot serve.
- Retail Media Networks: A significant portion of revenue growth in 2025 comes not from selling clothes, but from selling ads to the brands listing those clothes. The massive SKU count creates a competitive environment where brands must pay to be seen.
- Digital Shelf Hygiene: High rationalization rates (120%) act as a quality filter. By delisting “zombie SKUs” (items with views but no sales), algorithms ensure that customers are only shown products likely to convert, thereby increasing the overall Revenue Per Session (RPS).

Profitability, Efficiency, and Discoverability by Segment
This part of the analysis breaks down factors like first-order profitability (APOV:CAC), paid ad efficiency (POAS), and most critically, Product Discoverability across the different segments, clearly highlighting the strategic shifts required for survival and growth in an AI-driven search landscape.
1. Segment: 1 – 1,000 SKUs (Boutique & DTC Brands)
(Monthly Appearances)
Explanation of Development:
- The Profitability squeeze: The median APOV:CAC of 0.85 indicates that most boutique brands in 2025 are unprofitable on the first order. Rising CAC (driven by competition on social media platforms like Meta and TikTok) has outpaced their ability to raise prices. They are heavily dependent on a “Second Order” strategy, using email/SMS to drive a profitable second purchase within 60 days.
- LLM-Optimized Status: Discoverability grew 12% YoY, primarily driven by LLM mentions. AI search engines favor niche brands with high sentiment and distinct entity signals (e.g., “best sustainable linen shirt”) over generic keywords. Small brands with strong narratives are being cited more frequently by AI agents as “top picks,” even if their traditional SEO footprint is small.
2. Segment: 1,000 – 10,000 SKUs (Mid-Market Chains)
(Monthly Appearances)
Explanation of Development:
- The “Squeezed Middle” Correction: This segment saw a slight improvement in profitability (APOV:CAC +0.05) by aggressively rationalizing SKUs. By cutting ad spend on low-margin “tail” products and focusing budget only on high-POAS bestsellers, they improved their efficiency.
- Discoverability Stagnation: Discoverability is flat. These brands are often stuck in the “mushy middle” of AI search results: not niche enough to be a specific recommendation, but not large enough to dominate generic queries. They are losing visibility to marketplaces (on the high end) and hyper-niche boutiques (on the low end).
3. Segment: 10,000 – 100,000 SKUs (Department Stores & Large Specialty)
(Monthly Appearances)
Explanation of Development:
- First-Order Profitability: This segment achieves a positive ratio (1.15) largely due to Omnichannel attribution. By routing online orders to be fulfilled by stores (Ship-from-Store), they utilize inventory that is already “paid for” in terms of logistics, effectively lowering the variable cost per order.
- Discoverability Decline: Traditional search visibility is dropping (-5%) as buyers shift to social search (like TikTok and Instagram) and AI agents. Large, generic product listing pages (e.g., “Men’s Blue Jeans – Page 1 of 50”) are being de-ranked by search algorithms in favor of more curated, intent-based content.
4. Segment: 100,000+ SKUs (Global Marketplaces & Aggregators)
(Monthly Appearances)
Explanation of Development:
- The “Answer Engine” Winners: Discoverability exploded (+22%) because LLMs rely heavily on these platforms as “structured data sources.” When a user asks an AI for “options for a red cocktail dress,” the AI often cites Amazon, Zalando, or ASOS because their data is structured, reviews are abundant, and availability is verified.
- Profitability Moat: They achieve a high APOV:CAC (1.65) not because their margins are higher, but because their Organic CAC is near zero for millions of long-tail queries. They don’t have to pay to acquire every customer; they simply capture the existing demand traffic that smaller players cannot reach. Additionally, their POAS is inflated by Retail Media Revenue; they are selling ads to the brands, effectively subsidizing their own marketing costs.
Conclusion: The Softline Commerce Divergence (2025)
The Softline commerce landscape in 2025 is defined by a fundamental shift from achieving growth through “More” (larger catalogs) to “Better” (operational efficiency and strategic content). Revenue growth is no longer uniform across catalog sizes but is driven by distinct mechanisms for each segment:
(SKU Rationalization)
- First-Order Profitability (APOV:CAC): Smaller brands are struggling with profitability (ratios below 1.0) and are heavily dependent on repeat purchases. Only the largest two segments (10K+ SKUs) consistently achieve profit on the first transaction, primarily through scale efficiencies and omnichannel/service revenue.
- Discoverability: The rise of AI Answer Engines has fundamentally changed visibility. Marketplaces (100K+ SKUs) saw massive growth (+22%) due to their structured data, while hyper-niche boutiques (1–1K SKUs) also saw gains (+12%) via “Niche Status” recommendations. The “Middle” (1K–10K SKUs) experienced stagnation, losing visibility to both extremes.
- The Squeezed Middle: Mid-market players are successfully correcting efficiency metrics (improved POAS and APOV:CAC) through SKU rationalization, but they face a critical challenge in maintaining digital relevance as their discoverability remains flat against the backdrop of dominant marketplaces and rising niche brands.
4. Outliers
While market averages point to declining profitability and growing operational friction, a distinct group of outliers is breaking the pattern. These companies consistently outperform the Napkin benchmarks.
Outliers excel across many dimensions, but our analysis focuses on the areas where the gap is widest and where we believe growth is most directly influenced:
- Velocity & Growth: They achieve double-digit growth even at scale by launching products faster and by improving product discoverability.
- APOV:CAC: They achieve first-order profitability earlier by reducing returns (better fit data) and increasing basket size (better cross-sell data).
- SKU-2-Market Efficiency: They reduce the time to launch products from weeks to hours.
- Discoverability: They maintain or grow organic visibility by having richer, more structured product data that feeds LLMs and marketplace algorithms effectively.
1. A Connected Tech-Stack
Another key differentiator is how the tech stack is architected.
The average company operates in silos. Product data lives in spreadsheets, assets sit in shared drives, and ERPs are loosely or not at all connected to sales channels. This fragmentation creates friction, errors, and time drains that slow down new product introductions.
The outliers we’ve analyzed all have a tech-stack that is connected through a PIM or a custom-built data warehouse that acts as a single source of truth. This unlocks two critical advantages:
- Effective Use of AI
AI cannot perform on fragmented data. Outliers apply AI on top of structured PIM data to automate enrichment, translation, and tagging, cutting SKU-to-market time by more than 90 percent. - Automated Syndication
Instead of manually updating all internal data-sources and sales-channels, the outliers have everything connected and synced. This way, product data is updated almost in real-time everywhere, ensuring speed, consistency, and accuracy at scale.
2. Strategic Focus on Content-Led Growth
Another major trend that sets the outliers apart is that they have all implemented a content-led growth (CLG) strategy. Instead of treating SEO, PLO (Product Listing Optimization), and similar acronyms as isolated tactics, CLG brings them together under a single, coherent approach.
At its core, CLG is about clear branding, strong communication guidelines, and a systematic way of structuring and optimizing product content. These companies treat product information as a strategic asset, not an operational burden. The result is products that effectively sell themselves through better data, stronger visuals, and faster, more consistent availability across every channel.
Consumers Expected to Return $850 Billion in 2025. National Retail Federation (NRF) (2025).
https://nrf.com/media-center/press-releases/consumers-expected-to-return-nearly-850-billion-in-merchandise-in-2025
Consumer Products Report 2025: Reclaiming Relevance in the Gen AI Era. Bain & Company (2025).
https://www.bain.com/insights/consumer-products-report-2025-reclaiming-relevance-in-the-gen-ai-era/
Gartner Predicts Search Engine Volume Will Drop 25% by 2026, Due to AI Chatbots and Other Virtual Agents. Gartner (2025).
https://www.gartner.com/en/newsroom/press-releases/2024-02-19-gartner-predicts-search-engine-volume-will-drop-25-percent-by-2026-due-to-ai-chatbots-and-other-virtual-agents
Global E-commerce Statistics and Trends (2025) – Shopify Enterprise (2025)
https://www.shopify.com/enterprise/global-ecommerce-statistics
Product Feedprint™ Benchmark Report – Feedonomics (2025).
https://feedonomics.com/resources/product-feedprint-benchmark-report/
Social commerce share of e-commerce sales worldwide – Statista (2025).
https://www.statista.com/statistics/1251145/social-commerce-share-worldwide/
The State of Fashion 2025 – McKinsey & Company (2025).
https://www.mckinsey.com/industries/retail/our-insights/state-of-fashion
2025 Digital Success Metrics Benchmarks – Forrester (2025).
https://www.forrester.com/report/2025-digital-success-metrics-benchmarks-by-industry/RES190395