
2026 Commerce Napkin – Hardline
1. The Napkin
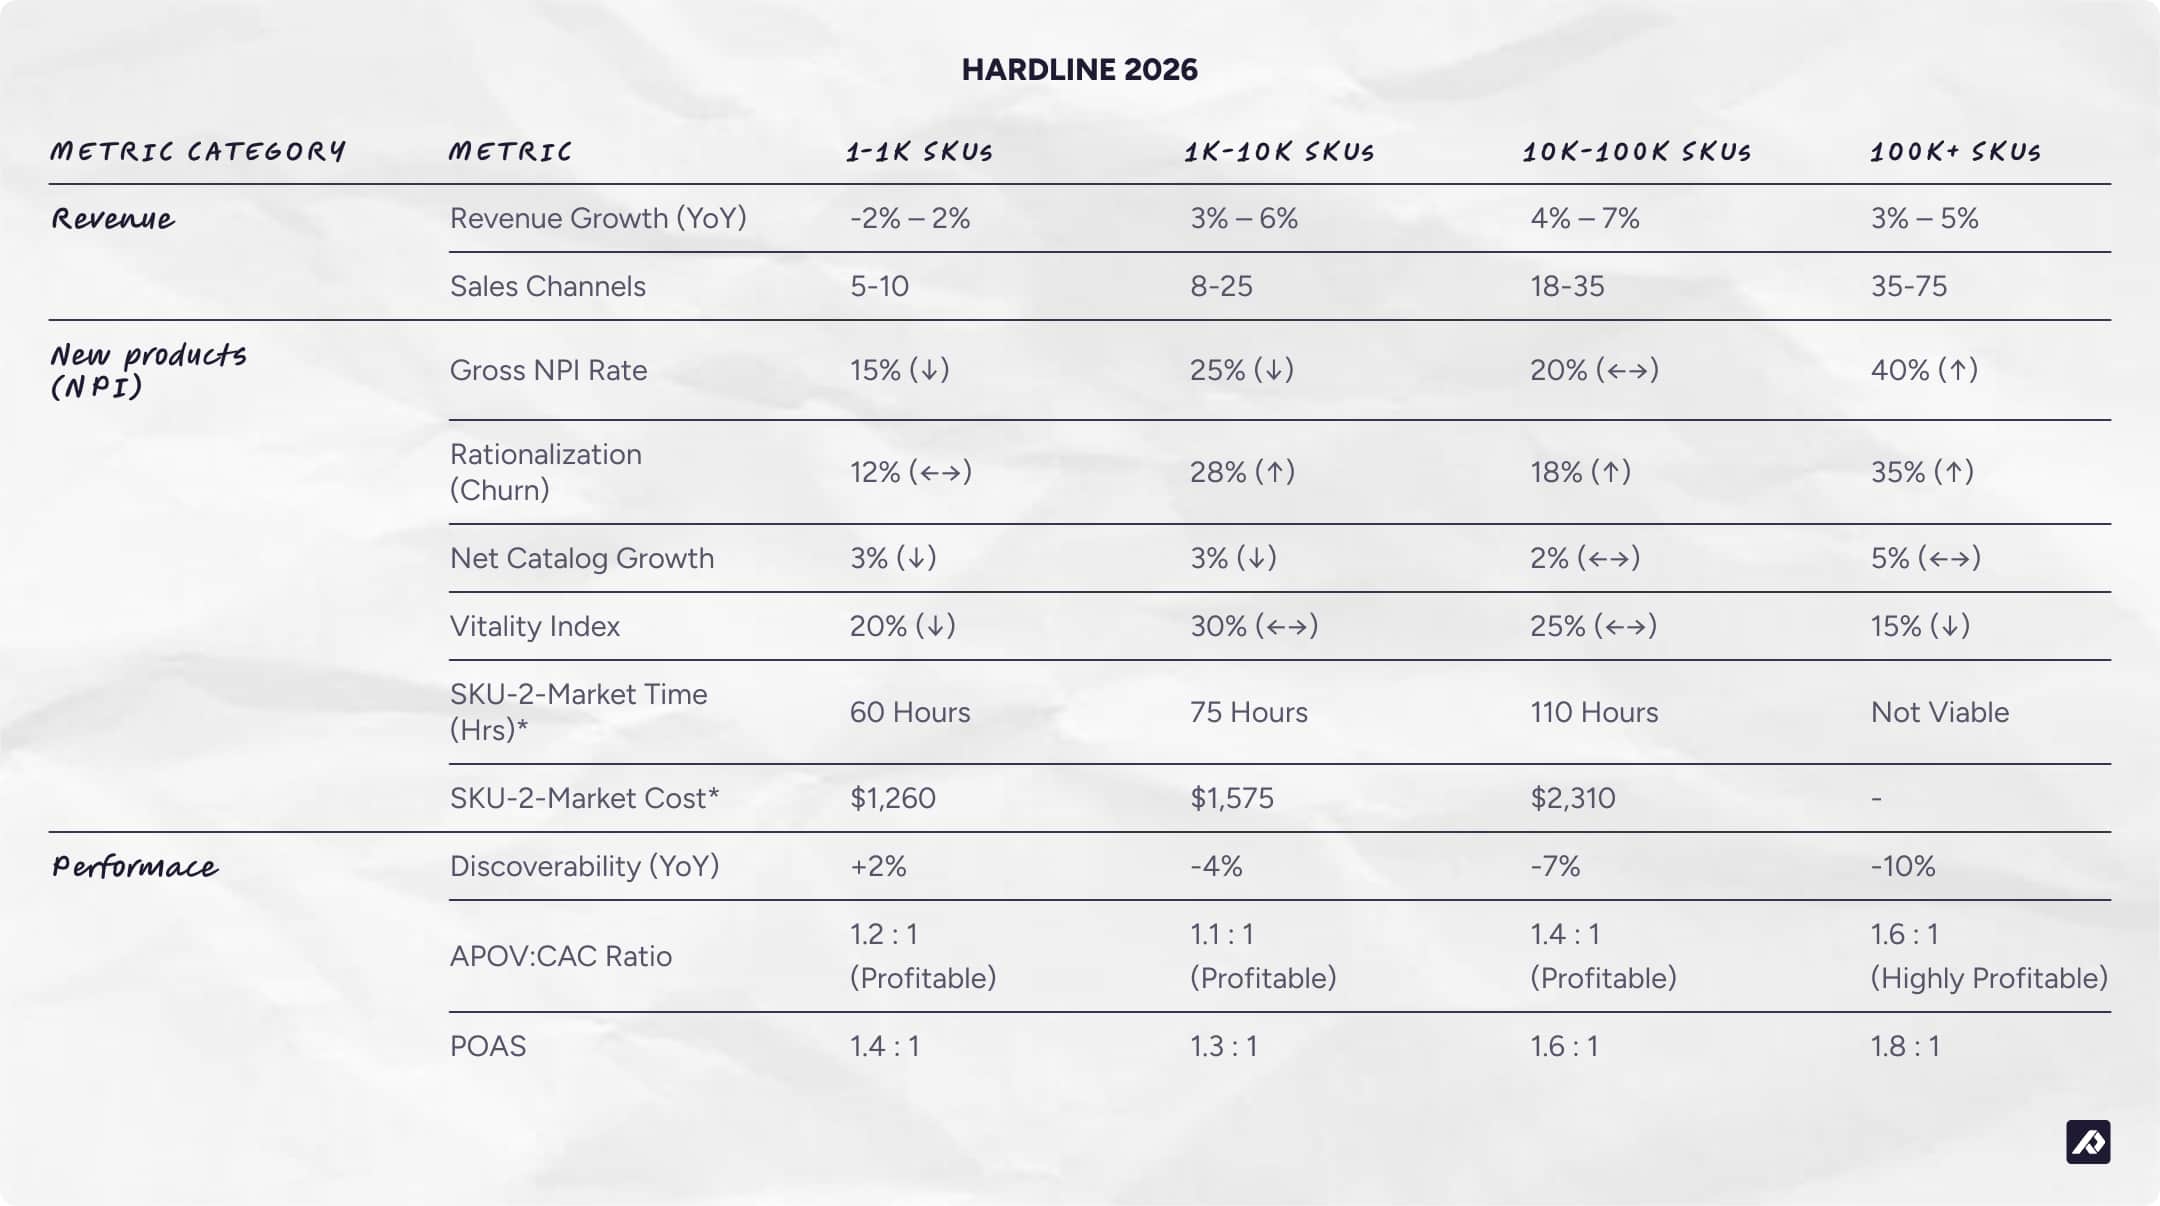
The following “Napkin” provides average commerce benchmarks across the Hardline vertical (Home, Garden, Furniture, DIY, and Sporting Goods), segmented by catalog size (SKU count).
2. Introduction
How to use the Napkin
The Commerce Napkin is designed to be an “at-a-glance” benchmark tool based on stats analyzed over the past 12 months. By tracking your company’s key metrics against the derived medians in the table above, you can identify where your operations stand compared to the market average for your specific size. It serves as a diagnostic tool to pinpoint whether you are lagging, performing at par, or outperforming the market in terms of growth, efficiency, and product health.
What industries are considered hardline: hardline Industries Defined
The Hardline vertical encompasses the following categories:
- Home & Garden: Lawn management, outdoor structures, and landscaping.
- Furniture: Indoor and outdoor furnishings, including smart and multifunctional furniture.
- DIY & Home Improvement: Tools, hardware, and paints.
- Hobbies, Toys, & Baby: Specialized recreational goods and durable infant equipment.
- Sporting Goods: High-ticket equipment like bicycles and gym equipment, as well as other daily specialized sports items.
We have grouped these distinct verticals together because they share fundamental operational and market characteristics that differentiate them from other sectors. These shared dynamics include:
- Low Catalog Velocity: Hardline products have long replacement cycles, as designs change infrequently and SKUs remain in-market for extended periods due to durability, high replacement cost, and low tolerance for frequent assortment churn.
- Similar Go-to-Market (GTM) Dynamics: Products have high regulatory requirements, such as logistical or technical assembly specifications. Consumers need the specifications to be exactly right before committing to a purchase. This drives a need for high-precision attributes like dimensions, compatibility, and spatial data. Their GTM mix includes a mix of B2B and B2C, with most companies now selling directly to consumers (D2C).
- Regulated Commerce: Cross-border trade is often restricted to neighboring regions unless a localized warehousing network is established.
Grouping them allows for the creation of meaningful, focused benchmarks, as seen in the Hardline Napkin, which accurately reflect the challenges and efficiencies specific to managing these product catalog types.
Definition of terms and metrics
- Velocity: The rate at which new SKUs are introduced, updated, or retired, reflecting how quickly assortments evolve due to seasonality, trends, and consumer demand.
- Gross NPI: The raw count (or percentage) of new SKUs introduced in a period.
- Rationalization (Churn): The percentage of SKUs discontinued or archived.
- Vitality Index: The percentage of total revenue generated from products launched within the last year.
- SKU-2-Market: The time (labor hours) and cost (at $21/hr) required to enrich, format, and publish 100 SKUs to all active channels.
- APOV: CAC (First-Order Profitability Ratio):
- Definition: The ratio of Average Profit per Order Value (Gross Margin $) to Customer Acquisition Cost (CAC). It measures whether a brand makes money on the very first transaction with a new customer.
- Formula:

- Signal: A ratio below 1.0 implies the retailer relies on repeat purchases (LTV) to become profitable. A ratio of at least 1.0 indicates immediate profitability on the first sale.
- POAS (Profit on Ad Spend):
- Definition: A measure of advertising efficiency that focuses on bottom-line impact rather than top-line revenue. Unlike ROAS (Revenue / Ad Spend), POAS accounts for the Cost of Goods Sold (COGS) and other variable costs.
- Formula:

- Signal: A POAS greater than 1.0 indicates that marketing is generating net profit. A POAS of 2.0 or higher is generally considered healthy for scaling.
- Product Discoverability (Search & LLM Visibility):
- Definition: The estimated median number of times a brand’s products appear in monthly digital search results, comprising traditional Search Engine Results Pages (SERPs), Generative AI answers (LLMs like ChatGPT, Perplexity), and Marketplace Listings.
- Signal: High YoY growth indicates successful optimization for the new “Answer Engine” economy (AEO) alongside traditional SEO.
3. Analysis
The Shift from "Impulse" to "Essential"
Revenue growth for the Hardline vertical in 2025 is no longer a byproduct of raw selection. A clear divide has emerged: small players are winning through specialization, while giants win through data-driven fulfillment and an omnichannel strategy. For mid-tier companies, growth now depends on “purchase confidence,” specifically using dropship efficiency and rich media to bridge the gap between browsing and buying.
1. Segment: 1 – 1,000 SKUs (Artisanal Furniture & Niche Tools)
- Primary Revenue Driver: Brand Story Narrative & Return Minimization
- Growth Mechanism:
-
- Friction-Managed Cross-Border: Because logistics costs for “Heavy & Bulky” (Furniture) or “Regulated” (Tools) items are high, international growth is often reactive rather than proactive. Success is measured by domestic full-price sell-through rather than aggressive global expansion.
- Data as Risk Management: Growth is protected by a heavy focus on high-precision attributes (Dimensions, Materials, Care Instructions). The objective is to manage customer expectations pre-purchase, as every costly return for a single-item furniture or tool product severely affects viability and margin.
- Relationship-Driven Sales: B2B sales are built on built on relationships with interior designers or local hardware stores, where the sale is driven by personal trust and quality, not platform discoverability.
2. Segment: 1,000 – 10,000 SKUs (Specialty Retailers)
- Primary Revenue Driver: Dropship Efficiency & Curated Selection
- Growth Mechanism:
-
- Reach Without Capital: Growth is achieved through the dropship model, which allows merchants to act as curators, increasing their market reach without requiring capital expenditure on their own warehousing. This is facilitated by effective 3PL partnerships.
- Confidence Through Media: To counter the sector’s high cart abandonment rate, revenue is driven by adopting rich media assets. The adoption of 3D models and Augmented Reality (AR) files becomes standard to allow customers to virtually “place” items, which has been proven to drive conversion and reduce expensive returns.
- B2B Procurement Integration: They start integrating with major retail procurement systems (e.g., Home Depot/Lowe’s vendor portals) to establish more stable, volume-driven revenue streams alongside B2C sales.
3. Segment: 10,000 – 100,000 SKUs (Category Leaders)
- Primary Revenue Driver: Purposeful Purchase & Data Localization
- Growth Mechanism:
-
- Market-Ready Data Integrity: For category leaders, localized data is the ultimate gatekeeper. Revenue is secured through sophisticated Attribute Localization, ensuring that regional compliance and measurement standards are natively integrated into their content system. This ensures products are correctly listed and shipped in every market.
- B2B Portal Sophistication: A significant portion of revenue is driven by sophisticated B2B portals that offer customer-specific pricing and “Punch-out” capabilities, allowing for direct integration into client procurement systems.
- Compliance Barrier: They master the complexity of attributes like Safety Data Sheets (SDS) and EU Energy Labels, turning compliance into a competitive barrier to entry against smaller, less-regulated competitors.
4. Segment: 100,000+ SKUs (Industrial/Home Giants)
- Primary Revenue Driver: Omnichannel Dominance & Macro Scale
- Growth Mechanism:
-
- Distributed Availability: Revenue is generated by achieving Omnichannel Dominance, integrating physical retail networks with digital sales via “Click & Collect” and local fulfillment, which unlocks trapped inventory and minimizes high-cost last-mile shipping.
- Most Complex Data Models: Stability is protected by managing the most complex data models in the Hardline sector, including hundreds of attributes for application data (e.g., compatible substrates) and granular repairability indices. This complexity locks in their position as the authoritative source.
- Market Correlation: Success is tied to housing starts and B2B trade sales. In this model, digital operations serve as a high-efficiency “capture engine” for volume dictated by the broader economy.

Profitability, Efficiency, and Discoverability by Segment
This part of the analysis breaks down how factors like first-order profitability (APOV:CAC), paid ad efficiency (POAS), and most critically, Product Discoverability, across the different segments clearly highlight the strategic shifts required for survival and growth in an AI-driven search landscape.
1. Segment: 1 – 1,000 SKUs (Artisanal Furniture & Niche Tools)
Explanation of Development:
- Immediate First-Order Profitability: The median APOV:CAC of 1.20 indicates that artisanal hardline brands are typically profitable on the first order. This is driven by the inherently higher average order value and strong gross margins found in niche, durable goods (e.g., specialized equipment, luxury fixtures). This immediate profitability allows them to reinvest capital with greater velocity and reduces the critical reliance on long-term Customer Lifetime Value (CLV) to recoup acquisition costs.
- Authority-Driven Discoverability: Discoverability growth is at +2% YoY. AI search engines favor these brands not for viral sentiment but for authoritative, data-rich signals. Since hardline items often have technical specifications and high-value decision criteria, AI agents cite them as a trusted source for complex queries (e.g., “best ergonomic desk for a home office”). This ensures they capture a high-intent audience with a strong likelihood of conversion.
2. Segment: 1,000 – 10,000 SKUs (Specialty Retailers)
Explanation of Development:
- First-Order Profitability Edge: The median APOV:CAC of 1.10 indicates that most specialty retailers remain profitable on the first order, a key stability indicator. This ratio is maintained, and slightly growing (+0.02), by a shift toward curated, higher-margin product lines. The focus here is on Inventory Discipline, specifically reducing capital tied up in slow-moving or overly-generic SKUs and allocating ad spend (evidenced by the +0.05 POAS growth) only to their best-performing, high-intent products.
- Discoverability Erosion: Despite having a high volume of monthly appearances, this segment’s visibility is declining (-4%). They are the clear “Squeezed Middle” of the hardline commerce shift. Their broad, yet not exhaustive, product listings are being passed over by both traditional search and LLM-driven search engines in favor of the hyper-specialization of boutique brands (1-1K SKUs) or the infinite-aisle dominance of companies selling on bigger marketplaces (100K+ SKUs). Their challenge is translating their scale into the authoritative digital relevance required to stem this visibility loss.
3. Segment: 10,000 – 100,000 SKUs (Category Leaders)
Explanation of Development:
- Scale-Driven Profitability: The high APOV:CAC of 1.40 and a strong POAS of 1.60 confirm this segment’s robust first-order profitability. This is primarily achieved through two mechanisms unique to their scale in hardline: Volume Sourcing Leverage (negotiating superior cost of goods sold, which widens margins) and Optimized Fulfillment. Unlike smaller segments, these leaders are successfully using their extensive distribution network (warehouses, stores) to lower variable fulfillment costs per order, driving the positive year-over-year trend in both metrics.
- Critical Discoverability Decline: Despite their large catalog, this segment faces the most significant challenge in the new digital economy, marked by a -7% drop in Product Discoverability. Their vast, yet generic, product listing pages are systematically being de-ranked by search algorithms and bypassed by generative AI search engines. These systems favor the structured, verified product data of global marketplaces or the deep, authoritative niche content of smaller brands. Category leaders are struggling to convert their massive scale into the necessary content quality and digital relevance, leading to a critical loss of organic traffic.
4. Segment: 100,000+ SKUs (Global Marketplaces & Aggregators)
(Monthly Appearances)
Explanation of Development:
- The Scale and Service Moat: This segment achieves the highest first-order profitability (APOV:CAC 1.60) in the hardline space, not primarily through product margin, but by establishing a near-zero-cost organic demand engine. Their massive authority captures millions of long-tail, high-intent searches, effectively making their Customer Acquisition Cost negligible. Furthermore, the significant growth in POAS (+0.18) is heavily financed by their Retail Media Networks, where they generate revenue from brands competing for visibility on their digital shelf.
- The Hardline Data Dilemma: Despite their sheer volume of appearances (75M+), this segment is suffering a severe drop in visibility (-10%). This critical decline is due to a failure to structure their vast, complex hardline product data (e.g., technical specs, compatibility charts) in a format that AI search engines can easily parse and cite.
Conclusion: The Hardline Commerce Divergence (2025)
The Hardline commerce landscape in 2025 marks the end of “Selection-Led Growth.” The market has split: growth is no longer about who has the most SKUs, but who has the best operational pulse. While the “Middle” fights for efficiency, the industry is being redefined by two extremes: Niche Authority and Logistics Dominance.
& Curated Reach
- First-Order Profitability (APOV:CAC): Hardline segments maintain a baseline profitability ranging from 1.1 to 1.4, anchored by high-intent, repair-based baskets. However, with the lower benchmarks leaving thin margins for fulfillment, the sector is moving toward a “Efficiency-First” model where growth is only sustainable if variable costs are strictly controlled.
- Discoverability: The vertical is facing a sector-wide discoverability wall, with massive giants seeing the sharpest declines (-10%). Success is increasingly tied to providing the structured data required by AI agents for project-based queries.
- The Squeezed Middle: Mid-market specialty brands are using SKU churn to improve operational efficiency but must navigate a flat-to-negative (-4%) discoverability landscape as they lose visibility to dominant aggregators and hyper-niche storytellers.
4. Outliers
While the market faces escalating shipping costs and operational friction, a distinct group of Hardline outliers stand out. These companies consistently outperform the Napkin benchmarks by mastering the digital-to-physical transition, effectively turning their physical footprint into a high-velocity fulfillment advantage.
Outliers excel across many dimensions, but our analysis focuses on the areas where the gap is widest and where we believe growth is most directly influenced:
- Growth: They achieve double-digit growth even at scale by successfully executing a profitable Omnichannel Logistics strategy (e.g., leveraging BOPIS/Click & Collect integration to unlock local store inventory) and by accelerating the launch of vendor-dropshipped SKUs to offer an optimized “Endless Aisle.“
- APOV:CAC: They achieve first-order profitability earlier by drastically reducing the sector’s high return rates through the use of 3D models and Augmented Reality (AR) files as standard product attributes. This also increases basket size by enabling automated cross-sell based on “project” or “room” attributes.
- SKU-2-Market Efficiency: They reduce the time to launch products from weeks to hours. This is achieved by automating the management of highly complex dimensional data (e.g., separating “Package Dimensions” for shipping from “Assembled Dimensions” for fit) and ensuring all required safety and energy compliance data is present.
- Discoverability: They maintain or grow organic visibility by having richer, perfectly structured product data that feeds visual search and comparison engines effectively. This includes providing all necessary dimensional, material, and assembly attributes to overcome the consumer’s purchase doubt in a considered-purchase environment.
1. A Connected Tech-Stack
Another key differentiator is how the tech stack is architected.
The average company operates in silos. Product data lives in spreadsheets, assets sit in shared drives, and ERPs are loosely or not at all connected to sales channels. This fragmentation creates friction, errors, and time drains that slow down new product introductions.
The outliers we’ve analyzed all have a tech-stack that is connected through a PIM or a custom-built data warehouse that acts as a single source of truth. This unlocks two critical advantages:
- Effective Use of AI
AI cannot perform on fragmented data. Outliers apply AI on top of structured PIM data to automate enrichment, translation, and tagging, cutting SKU-to-market time by more than 90 percent. - Automated Syndication
Instead of manually updating all internal data-sources and sales-channels, the outliers have everything connected and synced. This way, product data is updated almost in real-time everywhere, ensuring speed, consistency, and accuracy at scale.
2. Strategic Focus on Content-Led Growth
Another major trend that sets the outliers apart is that they have all implemented a content-led growth (CLG) strategy. Instead of treating SEO, PLO (Product Listing Optimization), and similar acronyms as isolated tactics, CLG brings them together under a single, coherent approach.
At its core, CLG is about clear branding, strong communication guidelines, and a systematic way of structuring and optimizing product content. These companies treat product information as a strategic asset, not an operational burden. The result is products that effectively sell themselves through better data, stronger visuals, and faster, more consistent availability across every channel.
Augmented Reality in Retail Market Analysis (2024-2036). 360 Research Reports (2025).
https://www.360researchreports.com/market-reports/augmented-reality-in-retail-market-203676
Consumer Products Report 2025. Bain & Company (2025).
https://www.bain.com/insights/consumer-products-report-2025-reclaiming-relevance-in-the-gen-ai-era/
DIY Home Improvement Market Report (2025-2033). Dataintelo (2024).
https://dataintelo.com/report/diy-home-improvement-market
Do-It-Yourself (DIY) Home Improvement Retailing Market Analysis, Size, and Forecast 2025-2029. Technavio (2024). https://www.technavio.com/report/do-it-yourself-home-improvement-retailing-market-industry-analysis
Exploring Innovations in DIY Home Improvement: Market Dynamics 2026-2034. Data Insights Market (2025).
https://www.datainsightsmarket.com/reports/diy-home-improvement-1320497
Gartner Predicts Search Engine Volume Will Drop 25% by 2026, Due to AI Chatbots and Other Virtual Agents.
https://www.gartner.com/en/newsroom/press-releases/2024-02-19-gartner-predicts-search-engine-volume-will-drop-25-percent-by-2026-due-to-ai-chatbots-and-other-virtual-agents
Global E-commerce Statistics and Trends (2025) – Shopify Enterprise (2025).
https://www.shopify.com/enterprise/global-ecommerce-statistics
2025 Digital Success Metrics Benchmarks. Forrester (2025).
https://www.forrester.com/report/2025-digital-success-metrics-benchmarks-by-industry/RES190395