
2026 Commerce Napkin – Consumer Packaged Goods
1. The Napkin
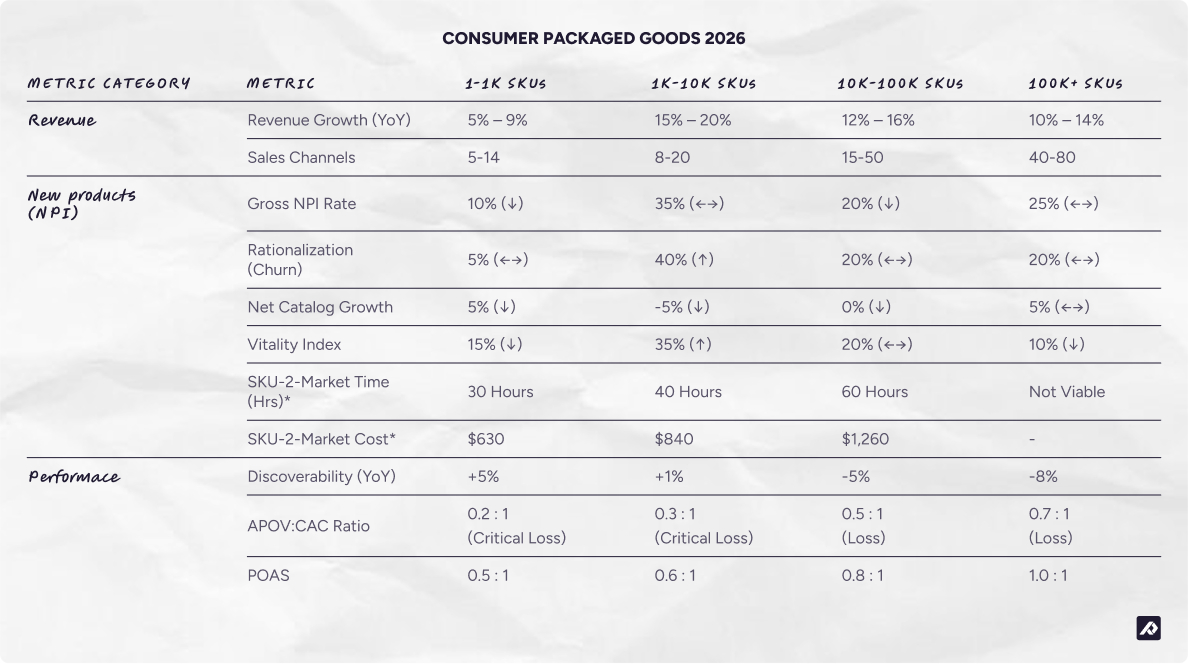
The following “Napkin” provides average commerce benchmarks across the Consumer Packaged Goods (CPG) vertical (Household, Personal Care, Pet, Baby, Food, Beauty, and Beverage), segmented by catalog size (SKU count).
2. Introduction
How to use the Napkin
The Commerce Napkin is designed to be an “at-a-glance” benchmark tool based on stats analyzed over the past 12 months. By tracking your company’s key metrics against the derived medians in the table above, you can identify where your operations stand compared to the market average for your specific size. It serves as a diagnostic tool to pinpoint whether you are lagging, performing at par, or outperforming the market in terms of growth, efficiency, and product health.
What industries are considered CPG: CPG Industries Defined
The CPG vertical encompasses the following categories:
- Food & Beverage: Perishable and non-perishable consumables, including frozen or shelf-stored goods, drinks, and supplements.
- Beauty & Cosmetics: Skincare, makeup, hair care, and fragrance products.
- Personal Care: Daily higyene items like soap, toothpaste, and other care products.
- Household Goods: Cleaning supplies and paper products.
- Pet Items: Pet care, food, and toys.
We have grouped these distinct categories together because they share fundamental operational and market characteristics that differentiate them from other verticals like softline (e.g., apparel, footwear) or hardline (e.g., furniture, DIY). These shared dynamics include:
- Low-Moderate Catalog Velocity: While some CPG product types evolve through incremental line extensions, seasonal offerings, and packaging refreshes, core SKUs remain stable to support brand continuity and supply chain efficiency.
- Extreme Data Compliance Burden: The core operational challenge is regulatory risk. Strict laws regarding labeling, ingredients, allergens, and expiration (e.g., FDA, EFSA) require a high level Master Data Governance to prevent label errors, which are a major cause of product recalls.
- Shift to the Digital Shelf: Historically dependent on physical retail, the sector now relies on “Digital Shelf Analytics” to drive discovery. This requires rich, non-compliance data like “usage occasions,” “scent profiles,” and “lifestyle” attributes to optimize ranking and conversion on online retailers and quick-commerce platforms.
- Omnichannel Strategy & Logistics Shift: The go-to-market (GTM) strategy is defined by selling through mass online retailers for volume (Amazon, Walmart) while using DTC channels to collect first-party data. The shift from “pallet shipping” to “parcel shipping” (DTC) requires specialized data feeds for quick-commerce and subscription models (e.g., Instacart, Subscribe & Save).
Grouping them allows for the creation of meaningful, focused benchmarks, as seen in the CPG Napkin, which accurately reflect the challenges and efficiencies specific to managing these types of product catalogs.
Definition of terms and metrics
- Velocity: The rate at which new SKUs are introduced, updated, or retired, reflecting how quickly assortments evolve due to seasonality, trends, and consumer demand. Hardline industries are characterized by lower seasonality, longer product lifecycles, and specification-driven complexity (e.g., Configuration/Compatibility/Performance attributes).
- Gross NPI: The raw count (or percentage) of new SKUs introduced in a period.
- Rationalization (Churn): The percentage of SKUs discontinued or archived.
- Vitality Index: The percentage of total revenue generated from products launched within the last year.
- SKU-2-Market: The time (labor hours) and cost (at $21/hr) required to enrich, format, and publish 100 SKUs to all active channels.
- APOV: CAC (First-Order Profitability Ratio):
- Definition: The ratio of Average Profit per Order Value (Gross Margin $) to Customer Acquisition Cost (CAC). It measures whether a brand makes money on the very first transaction with a new customer.
- Formula:

- Signal: A ratio below 1.0 implies the retailer relies on repeat purchases (LTV) to become profitable. A ratio of at least 1.0 indicates immediate profitability on the first sale.
- POAS (Profit on Ad Spend):
- Definition: A measure of advertising efficiency that focuses on bottom-line impact rather than top-line revenue. Unlike ROAS (Revenue / Ad Spend), POAS accounts for the Cost of Goods Sold (COGS) and other variable costs.
- Formula:

- Signal: A POAS greater than 1.0 indicates that marketing is generating net profit. A POAS of 2.0 or higher is generally considered healthy for scaling.
- Product Discoverability (Search & LLM Visibility):
- Definition: The estimated median number of times a brand’s products appear in monthly digital search results, comprising traditional Search Engine Results Pages (SERPs), Generative AI answers (LLMs like ChatGPT, Perplexity), and Marketplace Listings.
- Signal: High YoY growth indicates successful optimization for the new “Answer Engine” economy (AEO) alongside traditional SEO.
3. Analysis
The Shift from "More" to "Better"
In 2025, the CPG sector is moving from unrestricted brand expansion to a “Fewer, Bigger, Better” strategy. A clear divergence has emerged: while boutique specialists win on sentiment and “clean” innovation, global giants are pivoting toward retail media and private label dominance. For the mid-market, survival depends on “Portfolio Rationalization”—cutting the long tail to fund the “Vitality Index” of their core best-sellers.
1. Segment: 1 – 1,000 SKUs (Boutique Beauty & Food Startups)
- Primary Revenue Driver: Margin Accretion & Portfolio Pruning
- Growth Mechanism:
- Agile “Clean Label” Innovation: Growth is driven by transparency. These brands bypass traditional retail barriers by using social discovery and “clean” ingredient narratives to capture high-sentiment AI search citations.
- The Discoverability Paradox: While they lead the vertical in discoverability (+5%), they face a “First-Order Deficit.” With an APOV:CAC of 0.2:1, they rely entirely on high-velocity repeat purchases (LTV) and subscription “stickiness” to achieve eventual profitability.
- Vertical Community Building: Revenue is secured through direct-to-consumer (DTC) feedback loops. Unlike giants, they use real-time sentiment data to iterate products in weeks rather than quarters, maintaining a hyper-relevant but low-volume catalog.
2. Segment: 1,000 – 10,000 SKUs (Mid-Sized Brands & Portfolios)
- Primary Revenue Driver: Assortment Innovation & Subscription Scale
- Growth Mechanism:
- Aggressive Width Rationalization: Caught in the “Squeezed Middle,” these brands survive by “cutting the tail.” They use 40% SKU churn to eliminate underperforming variants, redirecting that capital to deepen stock for high-velocity “Hero” products.
- The Innovation Engine: This segment maintains the sector’s highest Vitality Index (35%). They thrive by quickly scaling trends (e.g., functional ingredients) that boutique brands pilot but cannot fulfill at scale.
- Subscription-First Logic: To stabilize cash flow during the “profitability crunch,” they prioritize subscription models over one-off purchases. This transforms unpredictable “Impulse” categories into predictable, recurring revenue streams.
3. Segment: 10,000 – 100,000 SKUs (Large Multinationals)
- Primary Revenue Driver: Margin Accretion & Portfolio Pruning
- Growth Mechanism:
- Complexity Reduction: Revenue growth is achieved by pruning legacy complexity. By targeting 20%+ SKU reductions, they remove “hidden costs” in the supply chain (manufacturing changeovers, slow-moving inventory) to focus on high-margin core items.
- Heritage Moat Defense: They leverage long-standing brand equity to defend against a -5% decline in traditional search discoverability. Their “moat” is built on bulk-buying incentives and “Prime-Position” retail placements that maintain shelf dominance.
- Regulatory & Compliance Mastery: Companies in this segment turn complexity into a barrier. They master global labeling laws and ingredient disclosures, making it difficult for smaller, less-resourced competitors to enter regulated international markets.
4. Segment: 100,000+ SKUs (Global Holding Companies)
- Primary Revenue Driver: Retail Media & Private Label
- Growth Mechanism:
- The Retail Media Pivot: These giants are no longer just product companies; they are media platforms. Growth is generated by selling ad space to competing brands within their ecosystem, effectively monetizing their massive “Digital Shelf” traffic.
- Private Label Substitution To offset a -8% “Discoverability Wall,” they aggressively replace underperforming national labels with high-margin Private Label staples. They use their own data to identify high-volume gaps and fill them with lower-priced, higher-margin house brands.
- Data Structure Superiority: Stability is protected by providing the highly structured, verified data that AI agents require. While their catalogs are cluttered, their backend systems ensure they remain the “Source of Truth” for broad, non-specific project queries (e.g., “Weekly grocery staples for a family of four”).

Profitability, Efficiency, and Discoverability by Segment
This part of the analysis breaks down factors like first-order profitability (APOV:CAC), paid ad efficiency (POAS), and most critically, Product Discoverability across the different segments, highlighting the strategic shifts required for survival and growth in an AI-driven search landscape.
1. Segment: 1 – 1,000 SKUs (Boutique Beauty & Food Startups)
Explanation of Development:
- The First-Order Loss Investment: The median APOV:CAC Ratio of 0.20 (Critical) indicates that these brands are built to be strategically unprofitable on the first order. They face a high “Discovery Tax” (rising CAC on Meta/TikTok), which is compounded by low initial cart sizes typical of CPG. This loss is accepted as an investment in acquiring first-party data (email, phone number) directly through the DTC channel, which is crucial for compliance and marketing.
- The Subscription Strategy & Profit Unlock: Given the initial loss, they are critically dependent on a “Second Order” strategy. Profitability is unlocked by immediate conversion to a high-retention subscription model or by driving a profitable second purchase within 60 days via targeted email/SMS campaigns.
- Compliance-Driven Discovery: Despite the competition, Discoverability grew 5% YoY. This is driven by mastering niche compliance attributes (e.g., “vegan,” “allergen-free,” “organic”) on digital shelves. AI search engines and online retailer filters favor brands whose rich attribute data perfectly matches consumer-specified filters, giving “clean” or “organic” startups an advantage in cutting through the mass-market noise, even with a small, focused catalog.
2. Segment: 1,000 – 10,000 SKUs (Mid-Sized Brands & Portfolios)
Explanation of Development:
This segment is the vertical’s true innovation engine with 35% Vitality. However, they are aggressively rationalizing (40% churn) as a survival tactic to reduce the manufacturing complexity that contributes to their critical profitability loss.
- The Acquisition Loss Strategy: The median APOV:CAC Ratio of 0.30 (Critical) structurally confirms a loss on the first transaction. This segment does not drive revenue growth (15%–20%) from initial sales margin but from volume achieved through syndication with major retailers and an aggressive “Subscribe & Save” adoption rate. The first-order loss is a subsidized Customer Acquisition Cost (CAC) for the high-margin, recurring revenue that follows.
- The Digital Shelf & Quick-Commerce Squeeze: The low and declining POAS (0.60) is a direct result of the intense competition on Quick-Commerce platforms (Instacart, UberEats), which are treated as distinct sales channels. The high cost of maintaining A+ Content (rich media, 360-views) across multiple B2C channels erodes ad efficiency and net profitability, confirming a high operational squeeze on digital shelf real estate.
- Scaling Through Compliance & Syndication: The high, yet slow-growing, Discoverability (580,000 with +1% YoY) reflects stability rather than organic growth. This volume is maintained by mastering EDI and GDSN connections (the standard for B2B channels), which standardize and syndicate the required attributes (including packaging and localization data) to major retail partners, driving volume growth despite the critical loss on direct digital sales.
3. Segment: 10,000 – 100,000 SKUs (Large Multinationals)
Explanation of Development:
- The Inflationary Profit Hedge: The median APOV:CAC Ratio of 0.50 (Loss) confirms that direct customer acquisition is highly inefficient for this segment. However, their high revenue growth is protected by Omnichannel dominance. Revenue is secured by an “Inflationary Lift” (consumers shifting to online bulk-buying for groceries, driving up basket size) and by leveraging physical distribution to fulfill online orders, effectively capturing margin through volume and inventory efficiency.
- The Retail Media Tax: Despite having a huge digital footprint (6.5M monthly discoverability), the 5% decline is a critical indicator of the pressure from Retail Media Networks. Online retailers are monetizing their digital shelf space, forcing CPG brands to pay a “tax” (via advertising) to secure visibility. The low POAS (0.80) suggests that paid efforts to drive sales are becoming increasingly expensive, resulting in a decline in organic visibility as algorithms favor paid placements.
- Localization and GDSN Governance: The core data challenge is maintaining complexity across multiple markets. The decline in discoverability is compounded by failures in data localization (e.g., ensuring the correct ingredient or packaging data is displayed for every country) and syndication through GDSN pools, where any compliance error can lead to a product being instantly delisted across multiple channels simultaneously
4. Segment: 100,000+ SKUs (Global Holding Companies)
Explanation of Development:
- The Supply Chain Profit Barrier: The median APOV:CAC Ratio of 0.70 (Loss) and a break-even POAS of 1.00 confirms that this segment is optimized for supply chain efficiency and market share, not digital-only first-order profitability. They absorb initial losses to maintain a dominant share of the digital shelf, relying on the massive volume generated through their EDI networks and the high-margin revenue from selling services (like retail media) to their own vendors.
- The Master Data Governance Crisis: The tremendous digital footprint (150M+ monthly discoverability) is rapidly contracting with an 8% YoY decline. This is directly linked to the crisis of Master Data Management. With a high attribute density per SKU, any failure to perfectly update compliance data, such as sustainability scores, carbon footprints, or plastic packaging taxes, results in millions of listings being filtered out or suppressed across dozens of fragmented global online retailers and AI agents.
Conclusion: The CPG Commerce Divergence (2025)
The CPG commerce landscape in 2025 is defined by a vertical-wide profitability crisis and a fundamental shift from achieving growth through “More” (SKU proliferation) to “Better” (operational efficiency and data density).
- First-Order Profitability (APOV:CAC): Every segment is currently operating at a loss on the first transaction (ratios 0.2–0.7). Survival is entirely dependent on high Customer Lifetime Value (LTV) and superior retention data.
- Discoverability: A “Discovery Wall” has emerged for large-scale players (-8%), as LLMs and AI search bots prioritize structured “usage-based” attributes over the cluttered catalogs of massive aggregators.
- The Innovation Paradox: Mid-sized manufacturers are the most effective innovators (35% Vitality) but also the most aggressive pruners, proving that growth is now a result of high-speed iteration rather than expansion.
4. Outliers
While market averages point to declining profitability (low APOV:CAC) and growing operational friction, a distinct group of CPG outliers is breaking the pattern. These companies consistently outperform the Napkin benchmarks by mastering the digital shelf and the compliance lifecycle.
Outliers excel across many dimensions, but our analysis focuses on the areas where the gap is widest and where we believe growth is most directly influenced:
- Velocity & Growth: They achieve double-digit growth even at scale by accelerating the speed of compliance-ready product syndication and improving Digital Shelf Visibility (getting to the top of the online retailer search results). Their speed is the ability to launch new formulations and packaging variants instantly across all channels globally.
- APOV:CAC: They achieve first-order profitability earlier by drastically reducing the high cost of paid customer acquisition (CAC) through successful organic search/AEO wins and maximizing the Customer Lifetime Value (CLV) by converting a high percentage of first-time buyers into high-margin subscription models.
- SKU-2-Market Efficiency: They reduce the time to launch products from weeks to hours. This is achieved by automating the normalization of all product data, from core compliance specs (ingredients, allergens) to rich media assets, to perfectly fit the technical demands of GDSN pools and major online retailer platforms.
- Discoverability: They maintain or grow organic visibility by having richer, more structured product data that meets both regulatory compliance (e.g., EU labeling) and Digital Shelf Analytics (DSA) requirements (e.g., “usage occasions,” “scent profiles”), ensuring they win filters on quick-commerce and online retailer platforms effectively.
1. A Connected Tech-Stack
Another key differentiator is how the tech stack is architected.
The average company operates in silos. Product data lives in spreadsheets, assets sit in shared drives, and ERPs are loosely or not at all connected to sales channels. This fragmentation creates friction, errors, and time drains that slow down new product introductions.
The outliers we’ve analyzed all have a tech-stack that is connected through a PIM or a custom-built data warehouse that acts as a single source of truth. This unlocks two critical advantages:
- Effective Use of AI
AI cannot perform on fragmented data. Outliers apply AI on top of structured PIM data to automate enrichment, translation, and tagging, cutting SKU-to-market time by more than 90 percent. - Automated Syndication
Instead of manually updating all internal data-sources and sales-channels, the outliers have everything connected and synced. This way, product data is updated almost in real-time everywhere, ensuring speed, consistency, and accuracy at scale.
2. Strategic Focus on Content-Led Growth
Another major trend that sets the outliers apart is that they have all implemented a content-led growth (CLG) strategy. Instead of treating SEO, PLO (Product Listing Optimization), and similar acronyms as isolated tactics, CLG brings them together under a single, coherent approach.
At its core, CLG is about clear branding, strong communication guidelines, and a systematic way of structuring and optimizing product content. These companies treat product information as a strategic asset, not an operational burden. The result is products that effectively sell themselves through better data, stronger visuals, and faster, more consistent availability across every channel.
Consumer Packaged Goods Market Size & Forecast. Markets and Markets (2025).
https://www.marketsandmarkets.com/Market-Reports/consumer-packaged-goods-market-125973933.html
Consumer Products Report 2025: Reclaiming Relevance in the Gen AI Era. Bain & Company (2025).
https://www.bain.com/insights/consumer-products-report-2025-reclaiming-relevance-in-the-gen-ai-era/
CPG trends in 2025: How brands can sell more on marketplaces. ChannelEngine (2025).
https://www.channelengine.com/en/blog/consumer-packaged-goods-cpg-trends-marketplaces
Gartner Predicts Search Engine Volume Will Drop 25% by 2026, Due to AI Chatbots and Other Virtual Agents. Gartner (2025).
https://www.gartner.com/en/newsroom/press-releases/2024-02-19-gartner-predicts-search-engine-volume-will-drop-25-percent-by-2026-due-to-ai-chatbots-and-other-virtual-agents
The Evolving CPG Consumer Packaged Goods Industry: Trends, Growth Drivers & the Digital Future. The Traceability Hub (2025).
https://thetraceabilityhub.com/the-evolving-cpg-consumer-packaged-goods-industry-trends-growth-drivers-the-digital-future/
2025 Digital Success Metrics Benchmarks. Forrester (2025).
https://www.forrester.com/report/2025-digital-success-metrics-benchmarks-by-industry/RES190395