

Product marketers and managers know that there is an overwhelming amount of data out there to be had. Data that can help them create more effective messaging for consumers, data that can help them save money and space when it comes to inventory, and data that—and the end of the day—is really the key to achieving revenue optimization.
If you’re wondering what all the hype is around revenue optimization and how you can use it to tie your data to sales and profit—keep scrollin’.
What Does Revenue Optimization Mean?
Revenue optimization is the process of strategically managing pricing, inventory, distribution, and demand in a way that maximizes (or optimizes) revenue.
And it all starts with data.
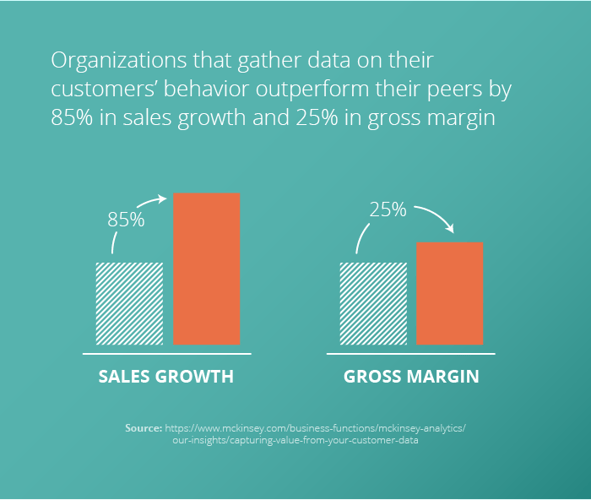
The brands that succeed at revenue optimization use historical, competitor, consumer, and product data to create everything from demand models to pricing predictions to consumer behavior forecasts. The more data the better when it comes to continuously improving products, out-marketing the competition, and optimizing revenue.
So once you have all your valuable data cleaned, organized, and made accessible throughout your organization (don’t worry, there’s an app for that); here’s how to put it to work maximizing revenue at your business.
A Guide to Using Data to Achieve Revenue Optimization
Consumer data is the great equalizer. You don’t have to have a million-dollar marketing budget to take advantage of it—all you need to do is follow this tactical guide to achieving revenue optimization.
How to Gather and Leverage Customer Data for Revenue, Retention, and Beyond
Here’s how an organization of any size and in any industry can leverage consumer data to increase retention, improve acquisition, boost personalization, enhance your web experience, create product listings that really move the needle, and ultimately achieve revenue optimization.
Use Customer Data to Improve Acquisition
Today’s consumer journey is complicated. Tracking with customers across various touchpoints, platforms, and devices can overwhelm even the most advanced acquisition strategies.
However, there’s an upside to the deluge—all kinds of juicy data.
Armed with plenty of consumer data, marketers are more empowered than ever to use their time and their funds to focus on acquiring users with the highest chances of converting.
Likewise, taking advantage of customer data helps businesses identify and double down on their most effective acquisition channels and initiatives.
Optimize Revenue with Data-Fueled Personalization
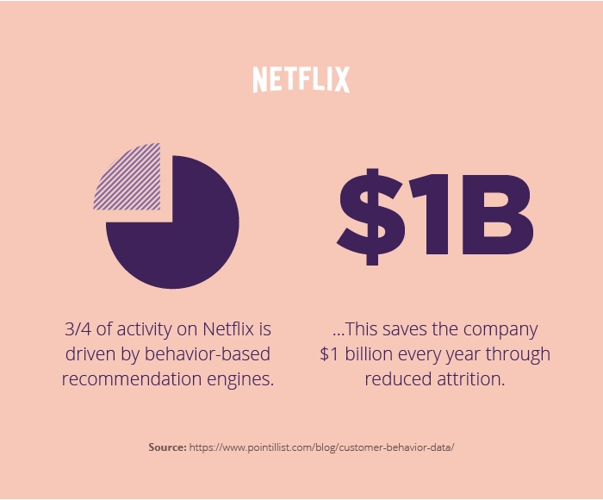
Netflix and Amazon didn’t become the giants they are today through hope and guesswork.
No, they lead the pack because they gather data that allows them to create personalized customer recommendations.
Personalization means developing unique content, offers, messaging, advertising, and other assets that align with important decision drivers for specific customer segments.
And consumers crave it.
In fact, nearly 80 percent of consumers say they’ll only engage with an offer if it’s been personalized according to their previous activities. A similar percentage report that relevant content boosts their purchase intent, so it should come as no surprise that increasing omnichannel personalization has been shown to grow consumer spending as much as 500 percent!
Integrate customer relationship management (CRM) software as well as a product information management (PIM) platform—which we’ll talk about a little more later—into your digital experience platform to enable personalization across channels.
Customer Data Boosts Retention and Saves Revenue
Retention goes hand in hand with personalization.
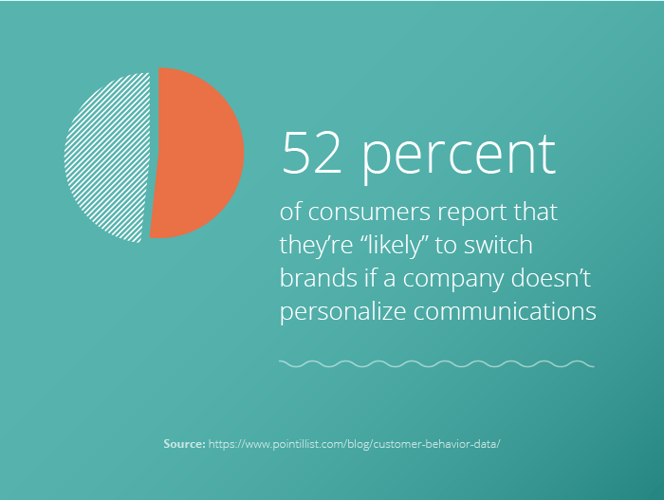
Over 60 percent of business buyers say they’re likely to switch brands if a vendor doesn’t personalize communications—and over 50 percent of consumers agree.
To reference Netflix again, the streaming service identifies the amount of usage individual consumers rack up each month that they stay subscribed. If their usage falls below that sweet spot—which indicates that they’re likely to churn—Netflix cranks up their recommendation engine to increase customer engagement, happiness, and retention.
Keep analyzing your customer behavior data like Netflix does in order to find patterns that may indicate churn. By getting ahead of it, you may be able to nip expensive turnover in the bud before a consumer gets serious about leaving—and taking a chunk of your revenue with them.
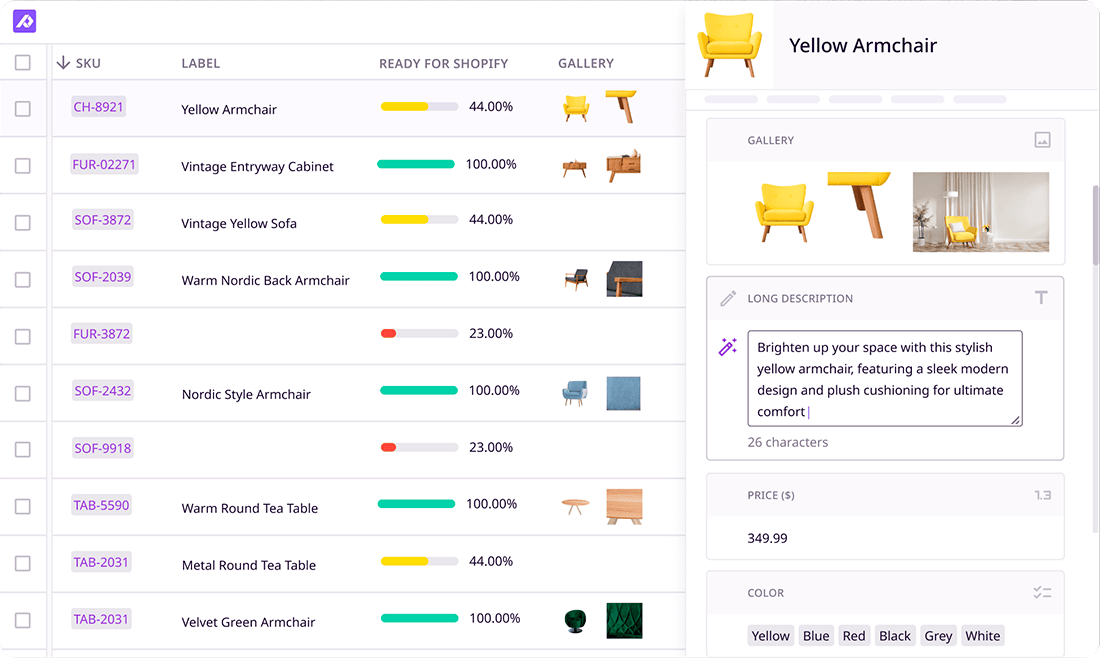
Use Product Analytics to Create the Product Listings People Want
The vast majority of consumers report that the content surrounding a product is extremely important in determining whether they make a purchase or not.
In addition, if they encounter poor or missing data in a product listing, over 75 percent of consumers would leave the site for a competitor. Only 5 percent would keep shopping.
Product listings are vitally important to an online brand or retailer’s success. And the best way to ensure you’re nailing those listings is by continually monitoring how they’re performing using product analytics.
Product analytics give marketers, content managers, and sole proprietors insight into how their product listings are engaging and converting consumers. With this valuable knowledge, businesses can make the necessary updates to achieve revenue optimization.
To take advantage of this opportunity to optimize revenue, find a product information management tool with analytics features that provide the easy-to-decipher data you need to determine and improve how your products are performing across a variety of channels.
Data Can Help Uncover Several Opportunities for Website and Revenue Optimization
Combine user testing tools and trackers like Google Analytics and Google Tag Manager that monitor activity on each of your links, buttons, pages, images, etc. to gather data on how people are using your website—and what changes you can make to optimize revenue.
Here are three tips for website and revenue optimization that you can steal from Build Grow Scale’s team of developers and data engineers who spend 500 hours each week managing split tests across over 20 different websites.
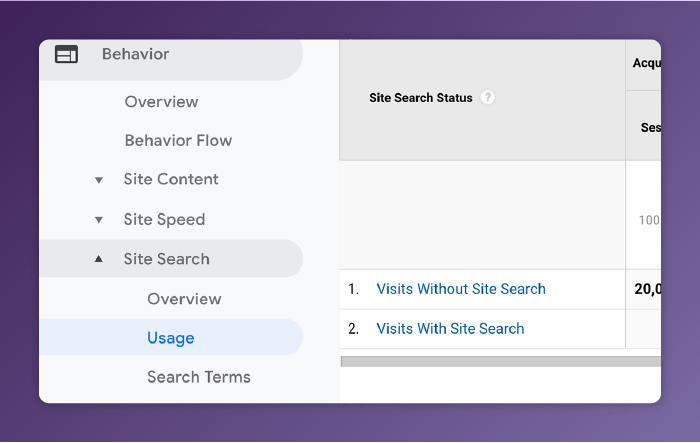
See What—and How—Visitors are Searching on Your Site
Use Google Analytics’ Site Search Tracking feature to find out what terms consumers are searching on your website. You can then plug these same terms right into your website pages, product descriptions, ads, and more to improve your search engine results pages (SERPs) ranking and on-site customer engagement.
It would also benefit you to make sure your search feature is easy to find and use. By tracking search functionality, The Build Grow Scale team found that 7 percent of the traffic on a particular site used the search bar—but they accounted for 20 percent of the site’s total revenue and converted nearly 15 percent of the time, which was double the standard conversion rate.
With a simple design tweak that made this particular search feature more obvious and easier to use, 13 percent of customers began to engage it regularly—boosting conversions and revenue.
Suss Out Underperforming Browsers, Resolutions, and More
Use Google Analytics to figure out exactly which internet browsers your site visitors are using—and how well each group converts against each other and against your averages. You can do the same with other factors such as operating system and screen resolution.
To revisit the Build Grow Scale team, one of their projects to optimize underperforming browsers for a client generated 125 additional sales per month for a total of $134,000 in new revenue in a single year.
Frequent technology updates can interfere or disagree with your website code, so it’s very likely you will find at least one powerful opportunity for boosting performance.
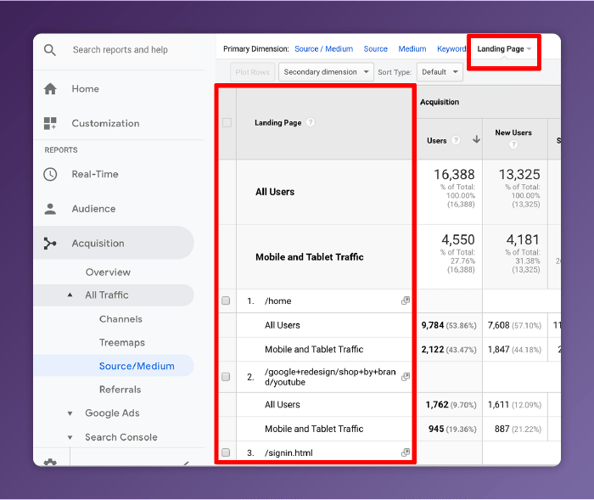
Find Out Why Your High-Traffic Pages Have Low Conversion Rates
Use Google Analytics to generate a report of page sessions and identify those that have unusually low conversions in comparison to traffic.
From there, apply Google Tag Manager as well as your user testing tool of choice to observe how consumers move through your site and identify where they drop off before converting.
After identifying one About Us page that only had a conversion rate of 2.4 percent despite bringing in over 13 percent of traffic, Build Grow Scale made some usability tweaks to increase conversions by nearly 7 percent, add 340 sales per month, and optimize yearly revenue with an extra $363,000.
Go Forth and Optimize Revenue with Your Customer Data
We hope that, by now, you can see how important customer data is for achieving revenue optimization.
Follow the above steps to leverage that data for retention, acquisition, personalization, website usability, product listings, and—ultimately—optimized revenue.
Questions about adding data on your actual products and their performance into the mix when it comes to revenue optimization? Check out any of our resources on the matter or get in touch with Plytix’s always-on and alway-friendly support team.
What if your product data actually worked for you?
We’ll show you how Plytix helps you stop fixing data—and start using it.


Think others should see this?
Go ahead and share it.