What is shopping cart abandonment and why does it happen?
Where does its detrimental effect hit the hardest?
What can retailers do to reverse this costly trend when it comes to their own businesses?
We’ll cover all that and more in this deep dive into 70+ shopping cart abandonment statistics you gotta know—and how to turn them in opportunities.
What Does Shopping Cart Abandonment Mean and Why Does it Matter to Me?
Alright, this is an easy one. Shopping cart abandonment is exactly what it sounds like: When a shopper leaves behind (or abandons) their digital cart without purchasing the items in it.
And, according to the Baymard Institute, the average global cart abandonment rate is just over 69 percent. However, as this rate continues to increase year over year, some experts predict it may eventually reach a whopping 90 percent.
In cold, hard cash; that adds up to consumers leaving about $4 trillion worth of products and services behind every year. However, smart sellers may be able to recover as much as 63 percent of those sales.
But before retailers can take back a cent, they have to understand what it is they’re up against.
45 Jaw-Dropping Shopping Cart Abandonment Statistics
Hold your nose, because we’re jumping into 45 shocking (yet true) shopping cart abandonment statistics.
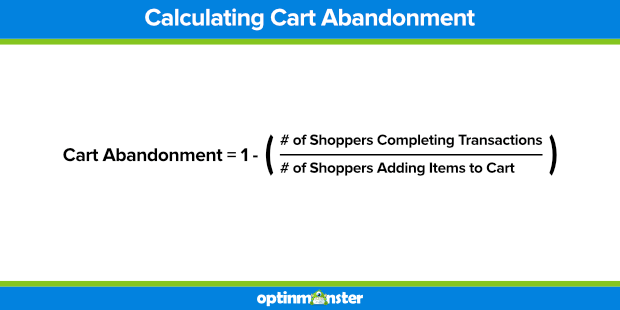
How to Calculate Shopping Cart Abandonment Rate
Finding an ecommerce business’ abandonment rate is a fairly simple calculation:
- Cart abandonment = 1 – (# of consumers completing transactions / # of consumers adding items to their carts)
Why Cart Abandonment Happens
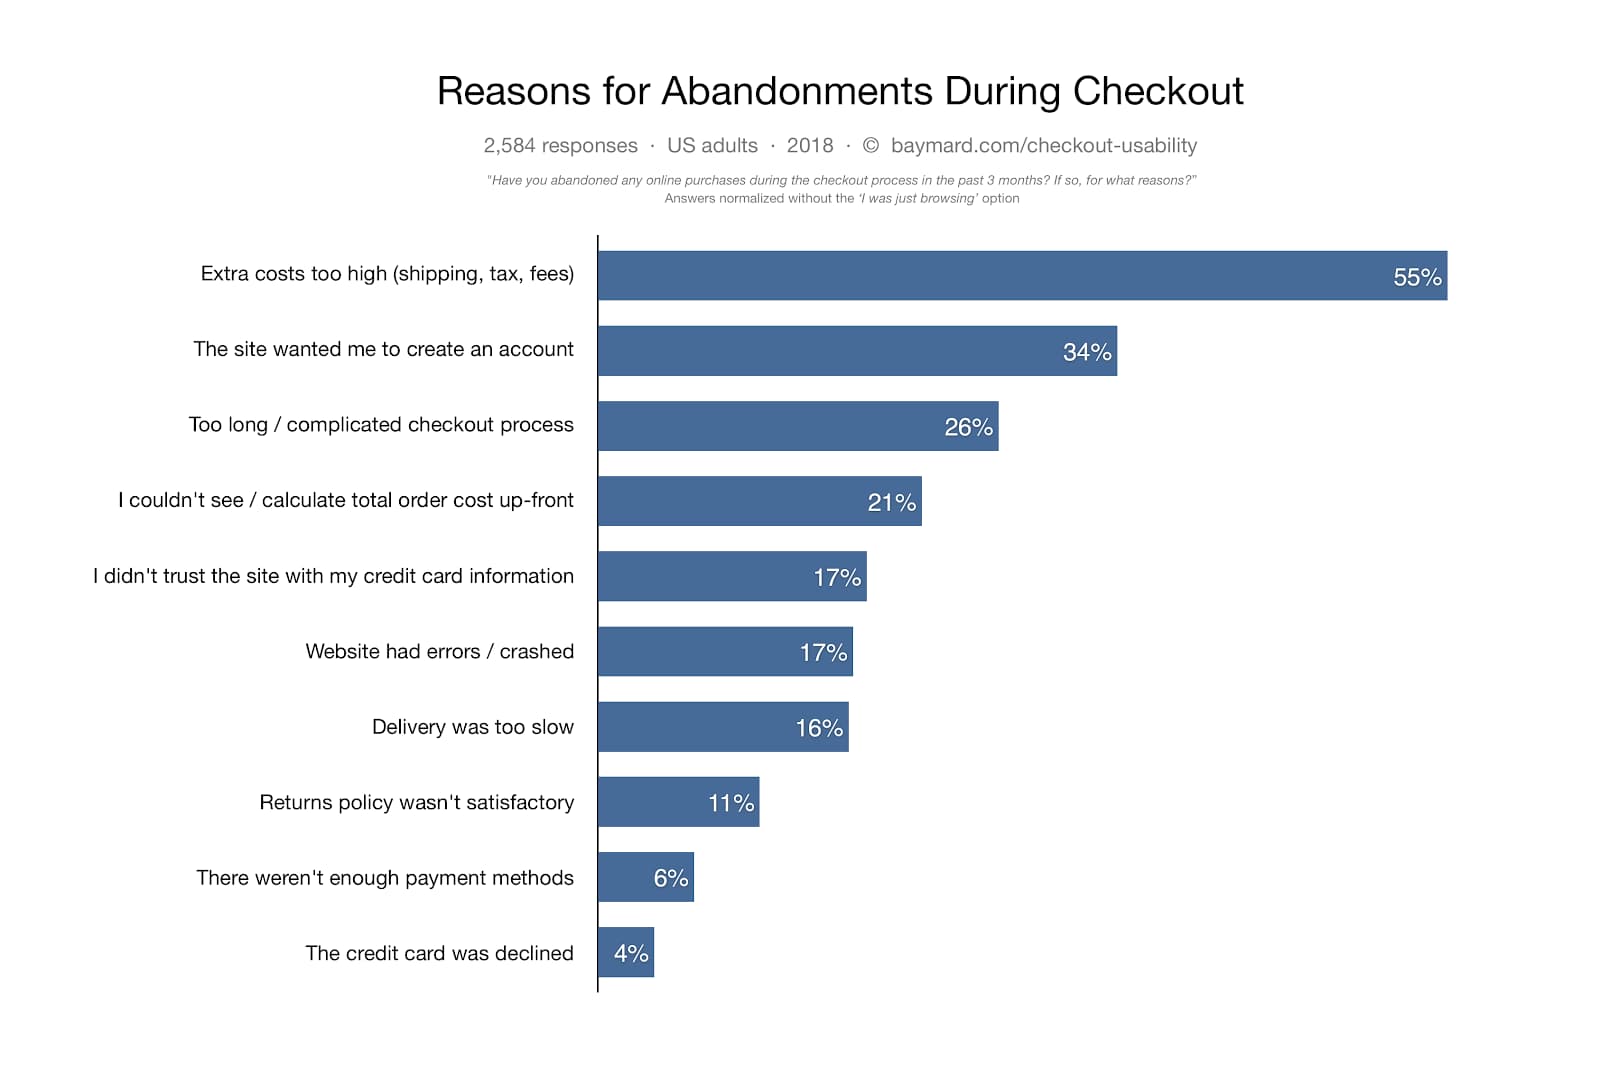
Perhaps it’s comforting to know that over 58 percent of online shoppers in the U.S. report abandoning a cart simply because they were just browsing, comparison shopping, or weren’t ready to buy for whatever reason.
When you remove that segment of cart abandoners, here are the other reasons consumers take off before completing their purchases:
- Extra costs (like shipping, taxes, etc.) were too high: 55%
- Registration required: 34%
- Checkout process long or complicated: 26%
- Couldn’t see the total cost before completing the transaction: 21%
- Didn’t trust the website with credit card details: 17%
- Website errors or crashes: 17%
- Expected delivery was too far out: 16%
- Unsatisfactory return policy: 11%
- Too few payment methods: 6%
- Declined credit card: 4%
Where in the World Cart Abandonment Happens
In 2016, SaleCycle consolidated data from over 500 global brands to determine what shopping cart abandonment statistics looked like around the world. Here’s what they found:
- Average global abandonment rate: 74.52%
- North America: 74%
- Latin America: 75.3%
- Europe: 70.9%
- Asia-Pacific: 76.3%
- Africa and the Middle East: 76.1%
Revealing cultural differences shed light on why each region’s shopping cart abandonment statistics are what they are—and provide some insight into how ecommerce professionals can better market in those areas.
- In the Asia-Pacific region, higher numbers of shoppers abandon their carts but they are less sensitive to shipping costs and lack of payment options.
- In North America, free delivery is almost expected when placing an online order. In fact, half of these consumers will abandon their carts immediately upon realizing there’s some kind of shipping fee.
- In both North America and Europe, consumers shop with the intent of buying more often.
- South Americans postpone their online transactions and are sensitive to payment options—two factors which may be interlinked.
What Industries Abandonment Rocks the Hardest
In 2018, the cart abandonment rate across popular industries was fairly similar—and fairly high:
- Total average abandonment rate across leading industries: 79.17%
- Retail: 74.58%
- Fashion: 74.13%
- Travel: 81.31%
- Finance: 77.97%
Why Do People Abandon Travel Purchases, Specifically?
Statistics prove that while travel purchases are quite complex and among the most abandoned, they are left behind for reasons similar to other online purchases:
- Consumers visit 38 websites on average before booking travel
- Shoppers browse for 45 days before finally booking their trip
- 39% of shoppers leave their carts behind to do more research
- 37% are looking for a cheaper price
- 21% are waiting to check with co-travelers
- 13% found the booking process too long or complicated
- 9% encountered technical issues
- 7% bounced due to payment issues or lack of options
When Are Carts Abandoned?
After looking at data from over a billion abandoned carts, SaleCycle was able to nail down when carts are most (and least) likely to be left without spending a dollar:
- Tuesdays have the highest abandonment rates
- Saturdays see the fewest abandonments
- Abandonments are at their lowest between 8 and 9 in the evening
- Carts conversions rise during Christmas, Black Friday, and similar sales periods

How Does Price Impact Cart Abandonment?
Unsurprisingly, shopping cart abandonment statistics fluctuate wildly with price. But surprisingly, they don’t simply go up as the dollar amount increases. Instead:
- Shopping cart abandonment is highest (around 85%) at price points below $25
- Abandonment falls to just under 60% at $80
- For items that cost between $100 and $120, abandonment rises to 77%
- Purchases between $150 and $200 are only abandoned 40% of the time
On Which Devices are Purchases Abandoned?
Shopping cart abandonment statistics as they pertain to digital devices show that ecommerce sites that perform poorly on mobile cost sellers a pretty penny:
- 73% of desktop users abandon their carts before completing their purchase
- 80% of tablet users abandon purchases
- Over 85% of mobile users abandon carts
26 Tactics to Help Reduce Your Shopping Cart Abandonment Statistics
As you’ve noticed, there are plenty of reasons why shopping cart abandonment happens. But instead of viewing it as a plague upon ecommerce, we encourage you to reframe it as an opportunity instead.
Here are more than 25 tactics you can employ to overhaul your online shopping experience and put those high shopping cart abandonment statistics in the rear view.
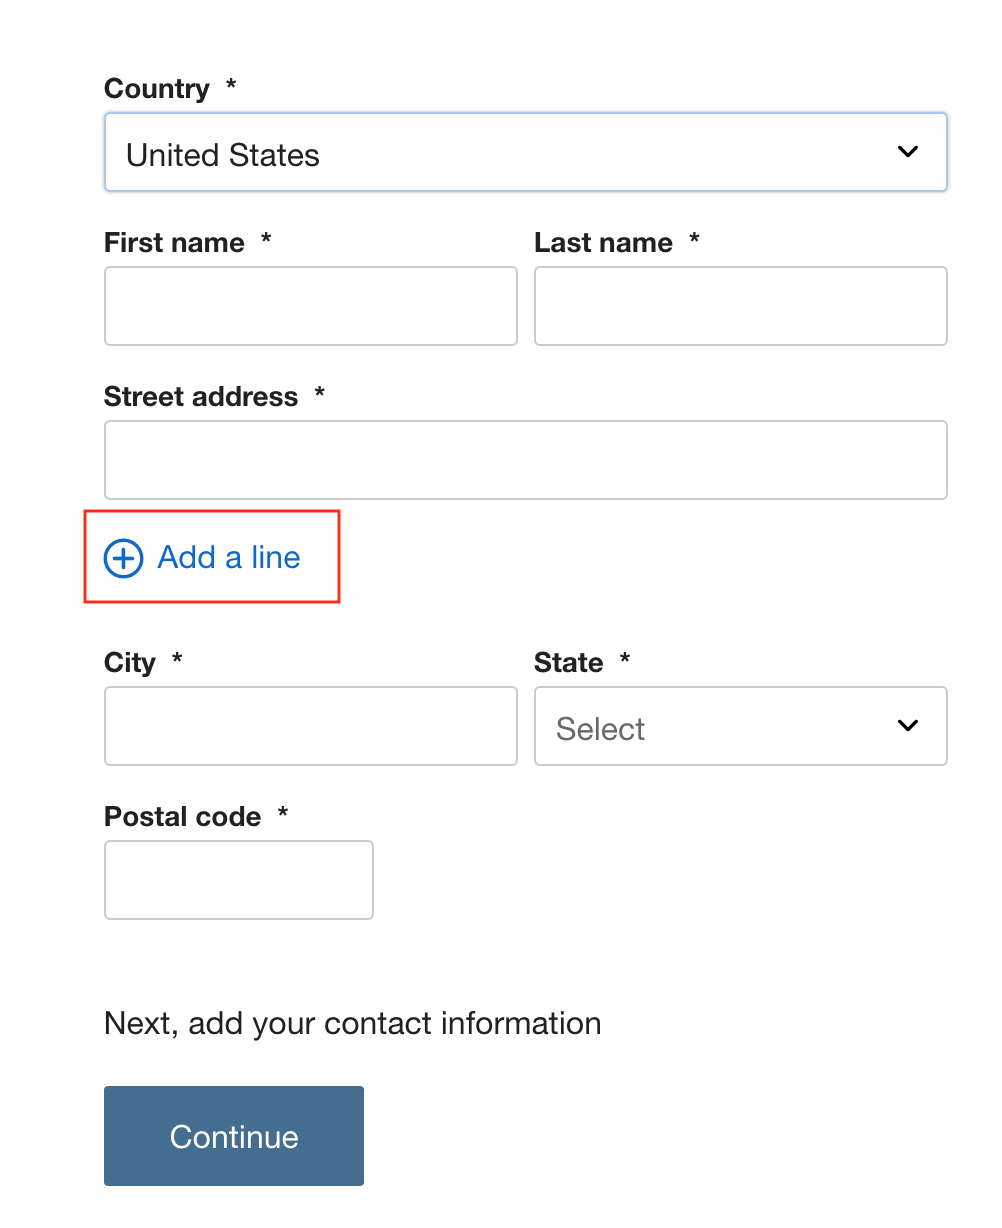
Reduce Friction in the Checkout Form
Over a quarter of shoppers abandon their carts because of an overcomplicated checkout process. That’s no surprise, considering a checkout usability study found that the average checkout has nearly 15 form fields—or twice as many as are necessary.
Thankfully, the same study also provided these three tips to help sellers simplify the checkout form and subsequently reduce cart abandonment:
- Business-to-consumer websites can hide lightly-used field such as “Address line 2” and “Company name” behind text links. Consumers who need them will still be able to access them while the majority of consumers who don’t won’t be confused or slowed down by them.
- Use a single field to collect the shopper’s full name instead of two separate ones for first and last names.
- Give the shopper a checkbox to indicate whether their shipping address is the same as their billing address. If the box is checked, move to the next stage of checkout without ever showing the fields. This update can cut the number of fields by nearly 40 percent on its own.
Try Re-Engagement Emails
Sending a shopper an email shortly after they’ve abandoned their cart has been shown to recover lost sales:
- Over 40% of cart abandonment emails are opened
- The travel sector enjoys the highest open rate with 49% and finance the lowest with 38%
- 21% of opened re-engagement emails receive click-throughs
- 50% of the users who click through end up making a purchase
- Fashion has the highest cart abandonment email conversion rate at 3.33%—and non-profit the lowest at 2.46%
- Re-engaged shoppers spend, on average, 55% more on every purchase than those who completed their purchase in one go
So what can you as a retailer do to re-engage consumers via email?
- Offer a discount, free shipping, or other incentives (bonus points if you put a timeline on the incentive to create a sense of urgency)
- Provide more info on the product, such as its great warranty or shining reviews
- For high-dollar products or even services, offer to schedule a call with one of your sales associates to talk through their concerns
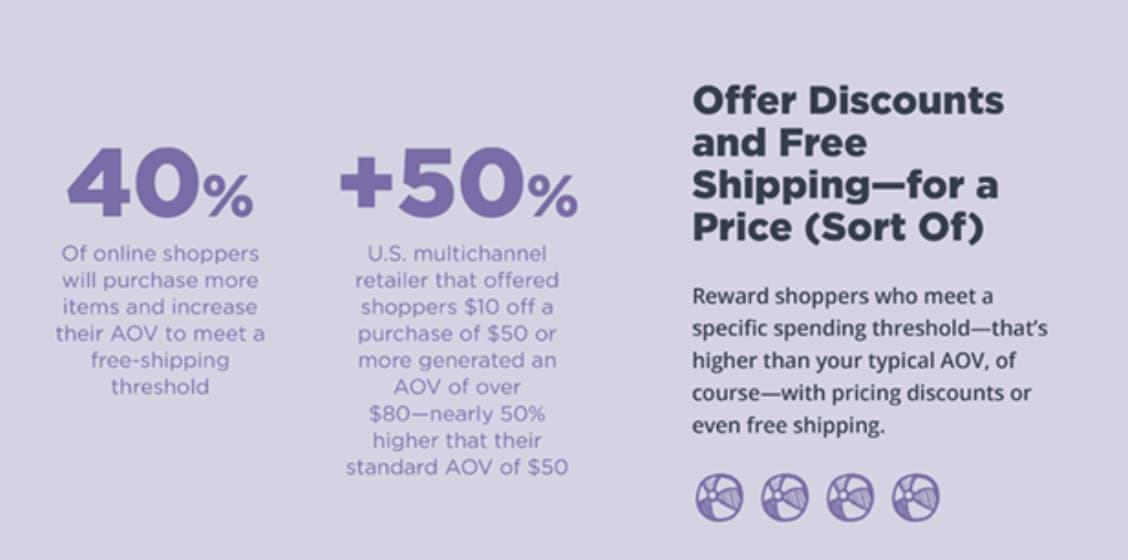
Make Shipping Free
When it comes to online sales, how to handle shipping is a hot topic. So first, let’s revisit the facts:
- The majority of consumers abandon their cart because extra costs, especially shipping, are too high
- 73% of shoppers consider free shipping very important when making online purchasing decisions
If you want to be at the top of the list when it comes to where savvy consumers shop, here are a few tactics to use shipping to boost your bottom line instead of dip under it:
- Build the cost of shipping into your product prices. You can position this decision to minimally raise prices as an investment in your ongoing commitment to excellent customer service.
- For a less complicated incentive, provide free shipping only when a shopper meets a certain threshold—again like cart total or total number of items.This trick also helps you grow your average order value.
- We’ve already learned that cart abandonment is at its highest (85%) for carts below $25 and second highest (77%) for those between $100 and $120. By offering free shipping when a cart reaches one or more of these high-abandonment totals, you may be able to improve those rates and close more sales.
Invest in Mobile
In 2018, 40 percent of sales were made via mobile on Black Friday—and that number is growing. Yet we know that over 85 percent of shoppers have still admitted to abandoning their mobile carts. Imagine how great your conversion rate could be if you followed these tactics for improving your mobile ecommerce workflow:
- Don’t just mimic website navigation—make it as simple and thumb-friendly as possible
Keep checkout and payment workflows short and sweet. Make sure you’re able to port in as much saved data (addresses, payment info, etc.) as you can. - Make the purchasing workflow accessible from every point, as mobile shoppers tend to be in a hurry and are easily distracted from their mission (or their browsing session).
- Build an app specifically for your ecommerce site.
- Use your app to send push notifications, but only to consumers who’ve shown strong purchase intent.
- Gamify your app to encourage shoppers to make bigger or more regular purchases.
Make Returns Less Likely and More Simple
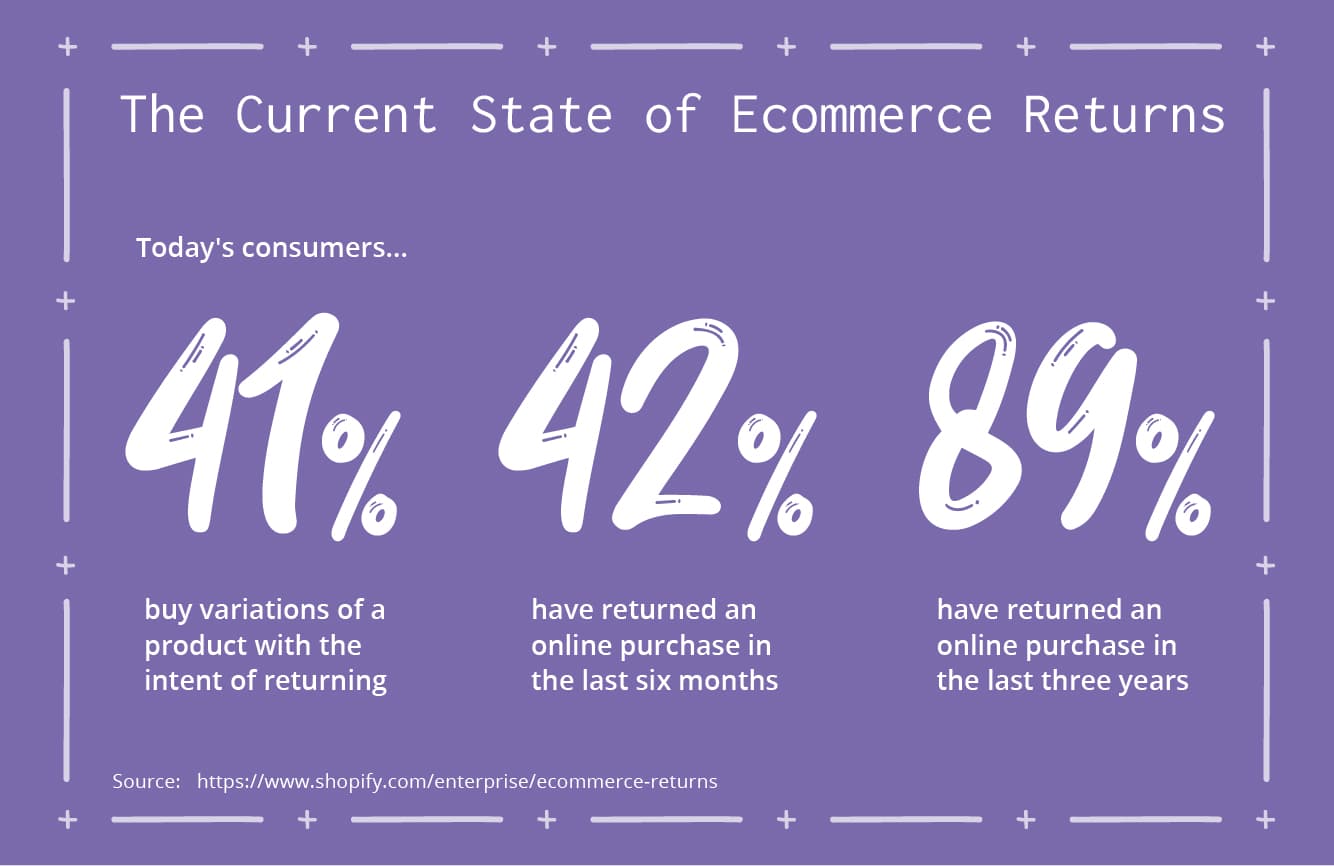
source
Online shopping returns are to be expected in this day and age. Unfortunately, that reality can be deadly expensive for businesses. Use these tips to reduce returns and handle them elegantly when they do inevitably happen:
- Over 20 percent of returns are made because the real-life product doesn’t look like what the website displayed. The solution? Use the most accurate, high-quality product photos, videos, and other resources you can to display your products!
- Incorporate product reviews and other social proof. A Boston University study found that reviews that specify details about product quality and usage contribute significantly to higher sales and lower returns.
- Set clear expectations with detailed product descriptions. Nearly half of returns are a result of products not matching consumer expectations. Unfortunately, keep up with countless details across thousands of SKUs on tens of sales channels means that’s way easier said than done. Today’s product information management (PIM) platforms are built specifically to give companies a single source of truth where they can store, share, and update all their important product information. If you’re interested in learning more about what PIM is, which features matter, and who the best providers are, Download the 2019 Ultimate PIM Buyer’s Guide for free.
- Over 60 percent of customers review a business’ return policy before they make a purchasing decision. It’s pretty clear you should have a simple one in place to help convert more shoppers—whether you choose to go the way of Zappos’ unlimited returns or Amazon’s bans for serial returners.
So You’ve Tackled Shopping Cart Abandonment, Now What?
Believe it or not, shopping cart abandonment statistics aren’t the be all and end all when it comes to important ecommerce metrics to keep an eye on.
If you’re feeling overwhelmed with where to start when it comes to keeping up with exactly which marketing methods, retail channels, and products you should spend your time and energy on—you’re not alone.